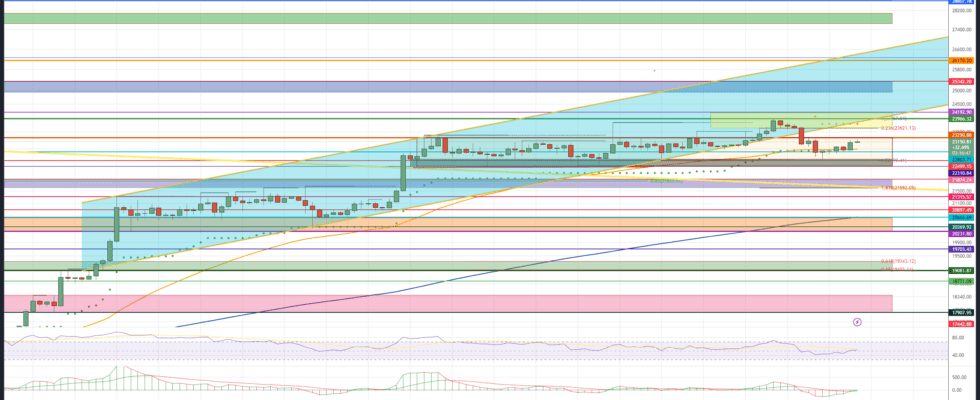
Due to the fundamentally important economic and company data in the coming days, a preliminary decision for the crypto currency Bitcoin and thus also for the overall market could be imminent. BTC price surged to a new historical high of $23,966 over the past weekend before consolidating back to the top of last week’s support zone of $22,547 on Monday. Bitcoin thus again followed the correction movement in the US stock indices. Strength in the US Dollar Index (DXY) also acted as a short-term headwind for the bulls. That the short quote of the Bitcoin futures on the CME in Chicago on the lowest level since August 2020 has slumped is clearly to be interpreted bullishly. At that time, the bull market started and Bitcoin was able to increase towards an all-time high of around 69,000 US dollars in the following 15 months.
As a result of the price setback, the BTC price slipped down from the turquoise uptrend channel, which now needs to be recaptured. To do this, Bitcoin needs to clear Sunday’s high to generate new price potential towards $25,200 and above. The bearish divergence in the daily chart, which has been discussed several times, continues to exist, but as long as Bitcoin does not sustainably correct below the $ 22,310 mark, the bulls will continue to have the scepter in their hands.
Nothing has changed on the higher-level bitcoin targets. They can be taken from the last price analysis of January 20th.
- Bullish price targets: $23,290, $23,621, $24,192, $24,925, $25,170/$25,342, $26,170/$26,269
Bitcoin: Bullish price targets for the coming trading weeks
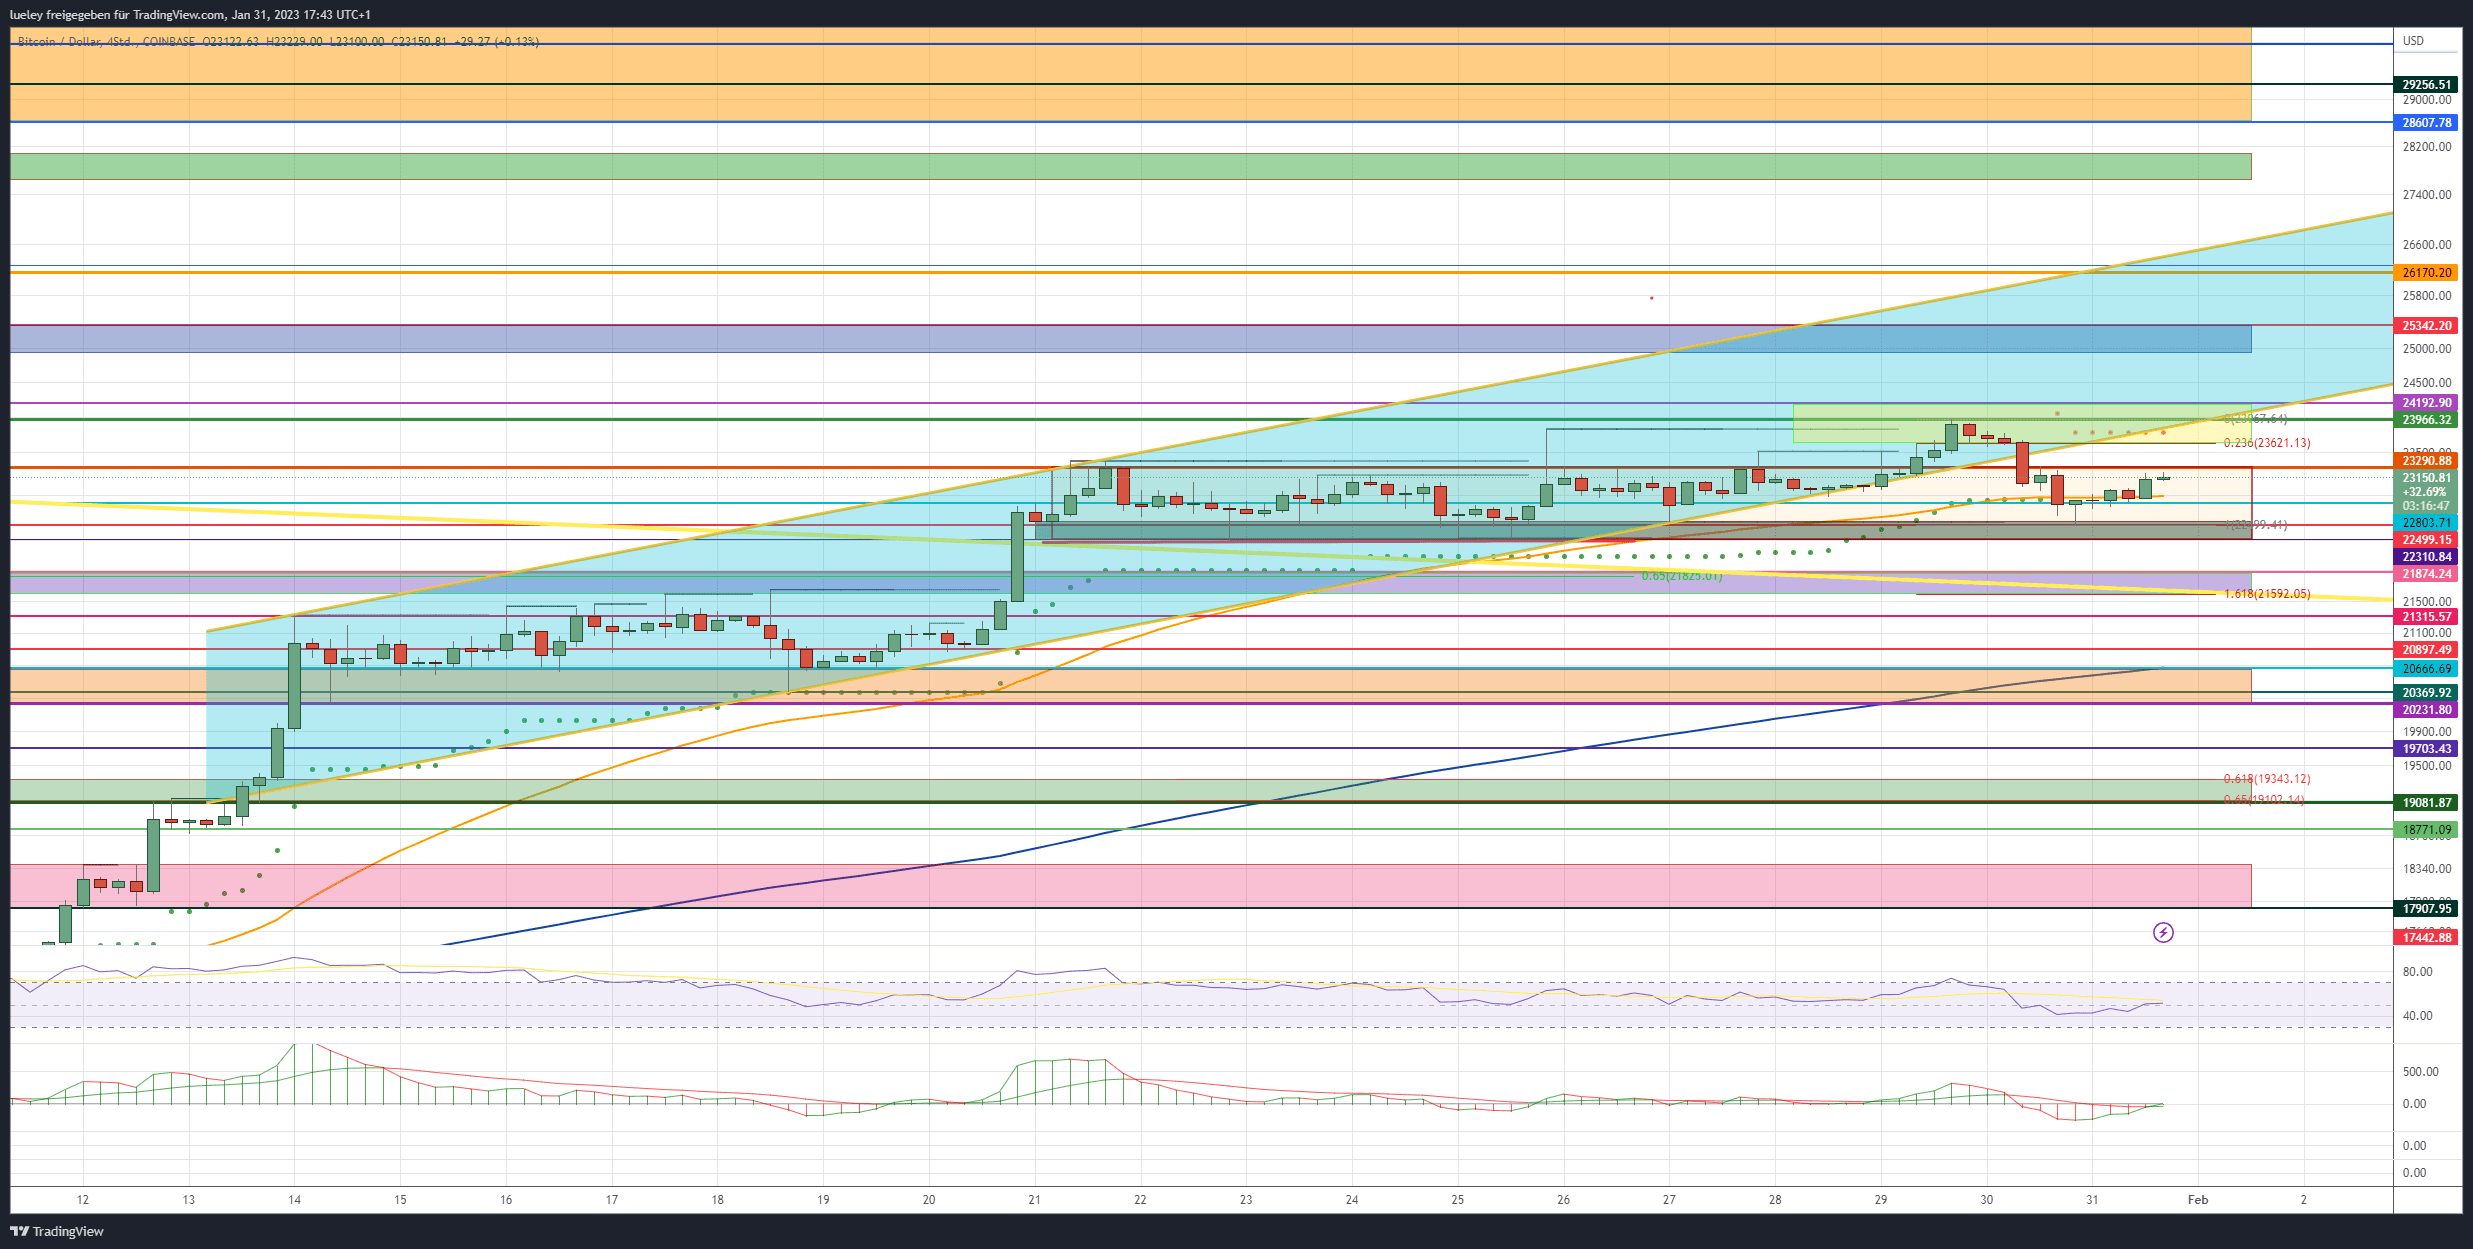
After yesterday’s reset back to the support zone of the last ten trading days, Bitcoin is currently recovering. The bulls now need timely stabilization above the resist at $23,290. If recaptured, the 23 Fibonacci of yesterday’s down move at $23,621 will come into focus. Just above that, the next strong resist is already waiting with the cross resistance from the supertrend and the lower edge of the trend channel. The whole yellow resistance area should become a Herculean task for the buy side and decide whether the trend movement of the last few weeks continues.
A decision for the coming trading weeks is imminent
Only when Bitcoin can break through this area at the daily closing price with increasing trading volume does the upward movement expand to the next important target area between USD 24,925 and USD 25,342. The high from August of the previous year can be found here. If there is no sustained course reversal in this zone and Bitcoin also sustainably overcomes the highs from the summer of 2022, a direct subsequent increase up to the 161 Fibonacci extension in the area of 26,200 US dollars should be planned. If the bulls can also pulverize this zone in the coming weeks despite a temporary price bounce, the upper edge of the trend channel will again come into the focus of investors as a target for growth.
The recovery movement is gaining momentum
- Bearish Targets: $22,803, $22,499, $22,310, $21,874/21,592, $21,315, $20,897, $20,666, $20,369/$20,226, $19,703, $19,346/19,081. $18,343
Bearish bitcoin price targets for the coming trading weeks
As long as the bears manage to counter the retake of the zone between $23,621 and $23,966 and then sell Bitcoin below the gray support area, a top formation is not off the table either. The bearish divergence in the daily chart clearly indicates this. If the BTC price falls below the US$ 22,310 mark for a sustained period due to the continued very rigid monetary policy of the central banks and weak quarterly figures from the US technology giants Amazon, Apple and Co., a sell-off down to the purple support area should be planned. However, since the EMA200 is also running here in the daily chart, a clear resistance from the bull camp is to be planned. Only when this area is broken through dynamically does the breakout level of January 20 come into focus. Between $21,874 and $21,592, the bulls will have to show their colors at the latest. The superordinate yellow downward trend line and the 161 Fibonacci extension of the consolidation movement that has been ongoing since the beginning of the week can also be found here. This strong support zone is therefore to be regarded as the first indicator on the underside. The bulls are likely to do everything in their power to initiate the next upmove.
The false breakout would have consequences for the bulls
However, if Bitcoin slips below this zone and the $21,315 mark is also abandoned, this would be an important point victory for the seller camp. After that, a correction extension to at least $20,897 is likely. Investors should then also keep an eye on the orange zone between $20,666 and $20,231. At $20,666, Bitcoin kept bouncing north on a 4-hour basis. In addition, the EMA200 (blue) can be found in this area in the 4-hour chart. If there is no sustained reversal back above the purple chart area and Bitcoin slips below $20,231, another significant sell-off can be expected.
Then the next price target is activated at 19,703 US dollars. However, this support should only last for a short time. A consolidation back into the green support area between $19,346 and $19,081 is more likely. Overall, this area represents the perfect swing long for medium and long-term investors. With the golden pocket of the corrective movement starting from the yearly high in combination with a so-called high-volume node, the bulls will be there. This zone therefore represents the maximum price target for the bears and, at the same time, the make-or-break level on the underside. At most, a short-term dip up to the breakout level of January 12th in the area of the red support zone would be manageable from the bulls’ point of view. However, the BTC price has to rise back above $ 18,343 by the end of the day. Otherwise, the whole bullish move threatens to end with a victory for the seller camp.
Disclaimer: The price estimates presented on this page do not represent buy or sell recommendations. They are merely an assessment by the analyst.
The chart images were created using TradingView created.
USD/EUR exchange rate at the time of going to press: EUR 0.92.
Do you want to buy cryptocurrencies?
Trade the most popular cryptocurrencies like Bitcoin and Ethereum with leverage on Plus500, the leading CFD trading platform (77 percent of retail accounts lose money with the provider).
The latest issues of BTC-ECHO Magazine
You might also be interested in this