Two maps to the “Midterms”
This is what the US election result really looks like
11/13/2022 10:57 p.m
The US midterm elections have not yet been decided: Important results are still pending in the House of Representatives. Does the US election map really glow almost everywhere in Republican red? ntv.de shows the true majority in the United States.
In the US congressional elections, vote counting is still ongoing in several states. As it became known over the weekend, the Democrats – the party of incumbent President Joe Biden – were able to majority in the Senate narrowly defend. The balance of power in the House of Representatives, on the other hand, is still open.
On Sunday evening, 20 of the 435 mandates had not yet been awarded. The reason for the delays are, among other things, special electoral regulations in individual states. The Republicans are just ahead in the House of Representatives. Most recently, it was 211 to 204 for the party, which also includes former President Donald Trump. The majority threshold in the “House” is 218 seats. The opposition Republicans only needed nine additional seats – the Democrats, on the other hand, needed 14.
Note: The ntv.de infographics are constantly updated.
Traditional US electoral map, electoral districts by area:
When looking at the conventional election map (here: “map view”), due to some peculiarities in US electoral law, the impression can easily arise that the US population is overwhelmingly on the side of the Republicans in this vote. Most of the area glows in Republican red.
However, the familiar geographic outlines paint a highly distorted picture: in elections to the House of Representatives, MPs are elected by constituency. To this end, the United States has been divided into 435 Congressional Districts (“Congressional Districts”), roughly sized according to population size.
The result: This division results in significant size differences between the densely populated regions, for example on the east and west coasts, and the rural areas in the middle west. Much of the United States glows red: the familiar outlines of the traditional election map give the impression of strong Republican dominance.
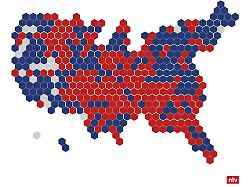
Stylized US electoral map, one-size-fits-all constituencies:
It tends to be only the sparsely populated rural regions where the Republicans are ahead. This makes the party appear stronger than it actually is. The large population centers, where the Democrats won in many places, take up less space on the classic US map. This makes them seem small and almost insignificant.
The skewed impression can be quickly corrected: A look at the stylized election map (here: “tile view”) shows the same data – only here the electoral districts are shown in the same size as hexagonal tiles. Each constituency in this so-called “tilemap” is represented by a regular hexagon. This gives a much more balanced picture in terms of the actual election result – the House of Representatives will not be dominated by Republicans in the future either. Majorities are extremely tight.
In the midterm elections in the middle of President Biden’s four-year term, all 435 seats in the House of Representatives and 35 of the 100 seats in the Senate were up for election. 36 governorships and other important offices in the states were also filled. The distribution of seats in Congress determines how much political leeway the incumbent president has for the remaining two years.