Bitcoin (BTC): Only an increasing trading volume can move the key crypto currency towards USD 28,000
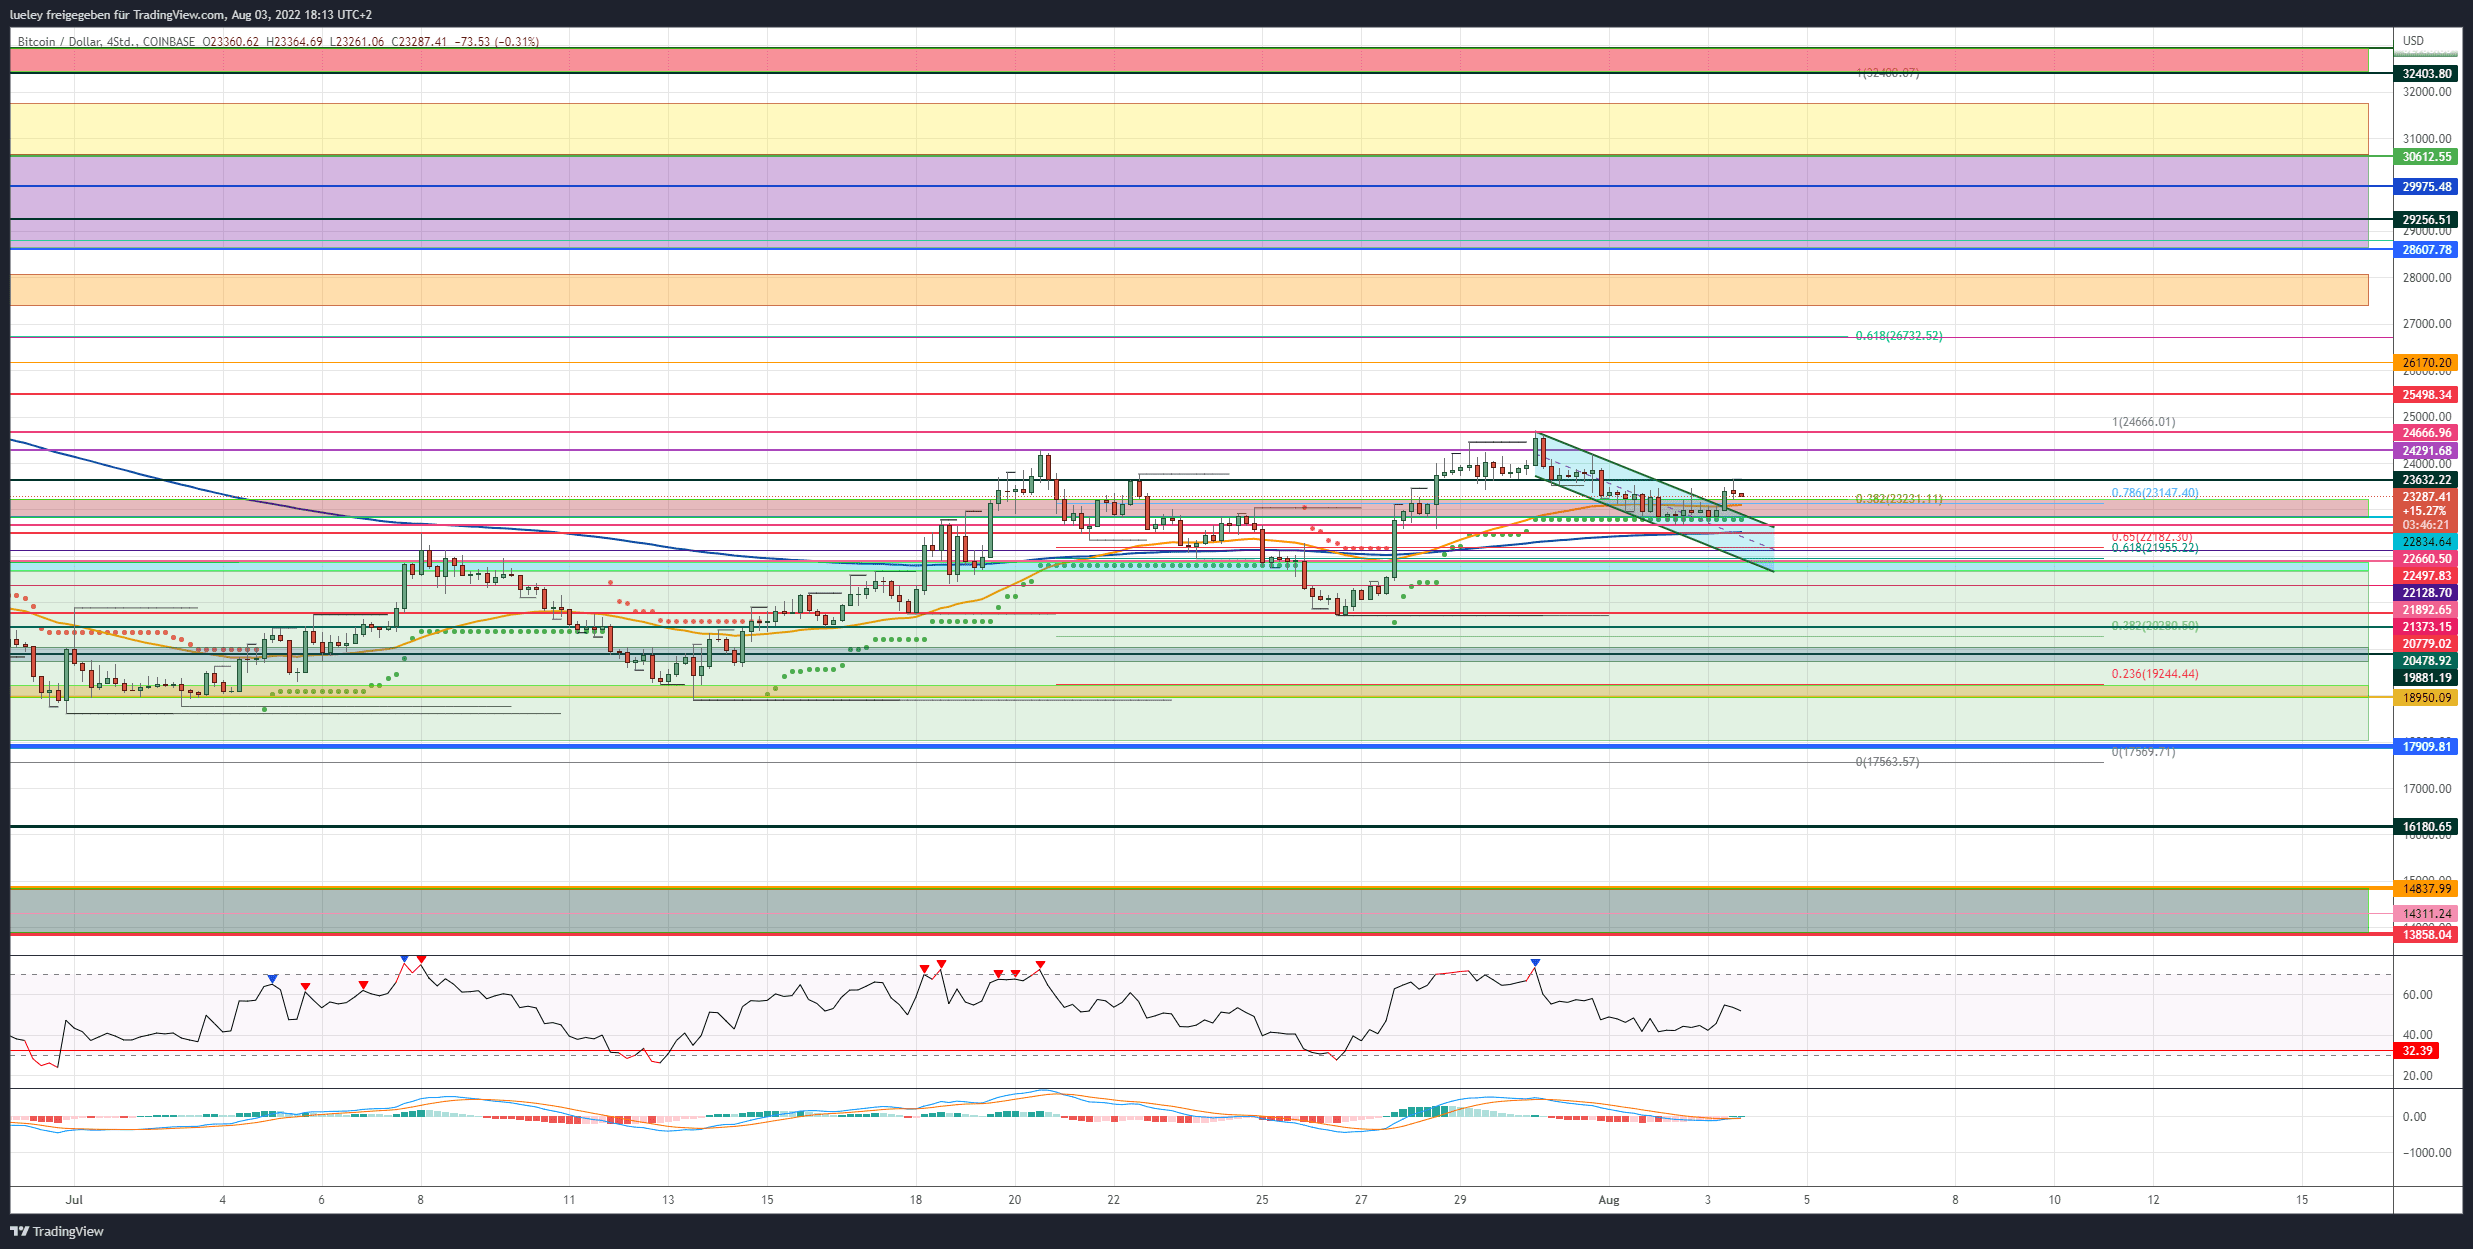
BTC rate: $23,287 (previous week: $21,300)
Resistances/Goals: $23,632, $24,291, $24,666, $25,498, $26,170, $26,734, $27,696/$28,104, $28,607, $29,256, $29,975, $30,612, $31,750, $32,433/$32,948
Supports: 23,147 USD, 22,834 USD, 22,497 USD, 22,128 USD, $ 21,373, $ 20,779, 19,881/20,036 USD, $ 19,604, $ 17,909/17,567 USD, $ 12.838 $13,858
Recap Bitcoin
- Another week, another breakout attempt. This is how you could describe the current price movements of the key cryptocurrency Bitcoin.
- Good business prospects from Amazon and Apple for the coming quarters have recently caused the Nasdaq technology index and the crypto sector to recover.
- Bitcoin used the positive signs on the classic stock market at the end of the previous week to initiate a renewed attempt to rise.
- Although the Bitcoin price rose to a new historical high of USD 24,666 last weekend, the low trading volume again prevented a sustained upward movement towards USD 28,000.
- As a result, Bitcoin slipped back below the resistance at USD 24,291 at the daily close and corrected at the top in the direction of the supertrend in the 4-hour chart at USD 22,834.
- Although the weekly low was slightly lower at USD 22,660, the bulls were subsequently able to heave the BTC price back above the supertrend at the close of the candle. The fact that Bitcoin is also trading above the EMA200 (blue) in the 4-hour chart, currently at USD 22,497, should be interpreted bullishly in the short term.
Mixed figures from US technology companies
- Even the departure of Michael Saylor as CEO of MicroStrategy did not have a negative impact on the BTC price yesterday evening, despite the company’s poor quarterly figures.
- The strong quarterly figures from the payment service provider PayPal are more likely to have a positive effect on the development of Bitcoin.
- The publication of the major labor market report in the USA next Friday, August 5th, could have further price impetus. The so-called Non-Farm Payrolls (NFP) usually cause an increase in volatility on the global financial markets.
- Of the Fear and Greed Index can increase again since last week’s analysis and is listed six points higher at 34. Investor fear is thus further reduced. Investors are again showing more courage when investing in the crypto space.
A look at the indicators
- The recent sell-off has brought the RSI and MACD indicators back to neutral territory on the 4-hour chart. The MACD is currently trying to generate a fresh buy signal again. The RSI could also promptly generate a fresh long signal on a 4-hour basis with a value of 55.
- Looking at the daily chart, the situation is a bit more complicated. On the one hand, both indicators show stable buy signals. On the other hand, the RSI indicator has now produced a bearish divergence. This can indicate further price consolidation and underpins the lack of trading volume in the last few trading days.
- As long as Bitcoin is above USD 21,373 at the daily closing price, the bulls can plan to break out again at any time.
Bullish Scenario (BTC):
- With low trading volume last weekend, the bulls again failed to start a sustained price breakout towards USD 26,170.
- Once again, after a false breakout on the upside, the BTC price fell back to the supertrend in the 4-hour chart around USD 22,800.
- Bitcoin is again trading above the EMA50 (orange) at USD 22,300 this Wednesday afternoon. The breakout from the short-term downward movement thus seems to have been successful for the time being.
- In the short term, however, the bulls must try to push BTC back above the USD 23,632 mark in order to subsequently initiate another attempt to increase towards USD 24,291.
- If the bulls succeed in stabilizing the price above this important resist in the coming days and Bitcoin then also collects the previous week’s high at USD 24,666, the resistance mark at USD 25,498 will first come into focus for investors.
The 61 Fibonacci retracement as a target in sight
- However, this price mark should only last for a short time. Rather, a march through to USD 26,170 is conceivable. However, the trading volume must also increase significantly for this to happen.
- If Bitcoin then also overruns USD 26,170, a preliminary decision will be made at the 61 Fibonacci retracement at USD 26,734.
- If there is no sustained buy-side profit-taking and Bitcoin stabilizes above the last historical high at $24,666, the bulls will target the orange zone between $27,696 and $28,104.
- A spike up to USD 28,607 can also be planned. If the bears then remain abstinent, Bitcoin should start the range between USD 29,256 and USD 29,975.
Will the breakout above USD 30,000 succeed?
- Although some bulls will want to secure profits at the psychologically important USD 30,000 mark, the probability of a price increase to the maximum bullish target area between USD 31,750 and USD 32,443 increases noticeably.
- As already mentioned in the last analyses, a price increase up to USD 32,443 should still be seen as a corrective recovery movement in an overriding downward movement.
- The zone between USD 32,433 and USD 32,938 is of key importance here. Since the moving average of the last 200 days (EMA200) is also in this range, the current bearish market structure will only break if it stabilizes above USD 32,938.
Bearish Scenario (BTC):
- The bears thwarted another breakout attempt above USD 24,291 last weekend. At the daily closing price, the seller side pushed the BTC price back below USD 24,000 with low volumes.
- Although Bitcoin slipped to a new weekly low of USD 22,660 yesterday, Tuesday, the sell-off dynamic was not enough to break the supertrend and the EMA200.
- To activate further downside potential, the bears need to sell BTC price below USD 22,446 again in the coming days.
- Bull resistance is already to be expected in the area between USD 22,182 and USD 21,955.
- If the BTC price slips below this support level for a long time and the upper edge of the old sideways range at USD 21,892 does not provide any support either, a price drop to USD 21,373 is likely.
A preliminary decision is approaching
- A preliminary decision can be expected here for the coming trading days.
- If this support is dynamically undercut, the area around the previous week’s low at USD 20,779 will again come into focus for investors.
- If the seller succeeds in breaking through this strong support, the chart picture will cloud over for a short time.
- As a result, Bitcoin would quickly drop back to at least $20,478.
New annual lows are becoming increasingly likely
- A direct sell-off up to the 38 Fiboancci retracement at USD 20,280 must also be planned. If the bulls remain abstinent here, the area around the psychologically important $20,000 mark will come back into focus.
- If this support can also be broken, the sell-off will immediately extend to the yellow support zone between USD 19,150 and USD 18,950.
- The probability of a bearish trend-following movement then increases massively.
- If the area around USD 18,950 does not hold either, the bears will want to sell off the BTC price via the intermediate station at USD 18,604 towards USD 17,909. This is the bulls’ last chance to stabilize the BTC price and turn the tide in their favor again.
The $14,000 target area on the downside
- If the bears counteract this with further sell-offs and the low for the year at USD 17,567 is also broken, a price slide to around USD 16,180 is to be expected.
- If the classic financial market also tends to go south again in the coming weeks of trading, a start of the support area between USD 14,837 and USD 13,858 cannot be ruled out.
Disclaimer: The price estimates presented on this page do not represent buy or sell recommendations. They are merely an assessment by the analyst.
The chart images were created using TradingView created.
USD/EUR exchange rate at the time of going to press: EUR 0.98.
Do you want to buy cryptocurrencies?
eToro offers investors, from beginners to experts, a comprehensive crypto trading experience on a powerful yet easy-to-use platform. We took a close look at eToro.
To the eToro review