How much do executives earn? The officials? Teachers? The women? Men? Salaries under 25? And the forties? Insee provides you with all the answers in the annual edition of its study Employment, unemployment, income from work. Costed travel to the country of monthly remuneration. Net!
Average salaries: executives earn double that of employees and workers
Average salary, in France? 2520euros net per month, in full-time equivalent, in the private sector, which corresponds to an average of full-time, 35 hours. For a manager, the average passes 4330euros net monthly… but 4600euros for men and 3860euros for women. At the other end, workers earn 1,640 euros on average each month, in full-time equivalent.
| Women | Men | Together | |
| Frames | 3,860 | 4,600 | 4,330 |
| Intermediate professions | 2,300 | 2,620 | 2,470 |
| Employees | 1,770 | 1,860 | 1,800 |
| Workers | 1,640 | 1,910 | 1,860 |
| Together | 2,290 | 2,690 | 2,520 |
Median salaries: 1890euros for women, 2100euros for men
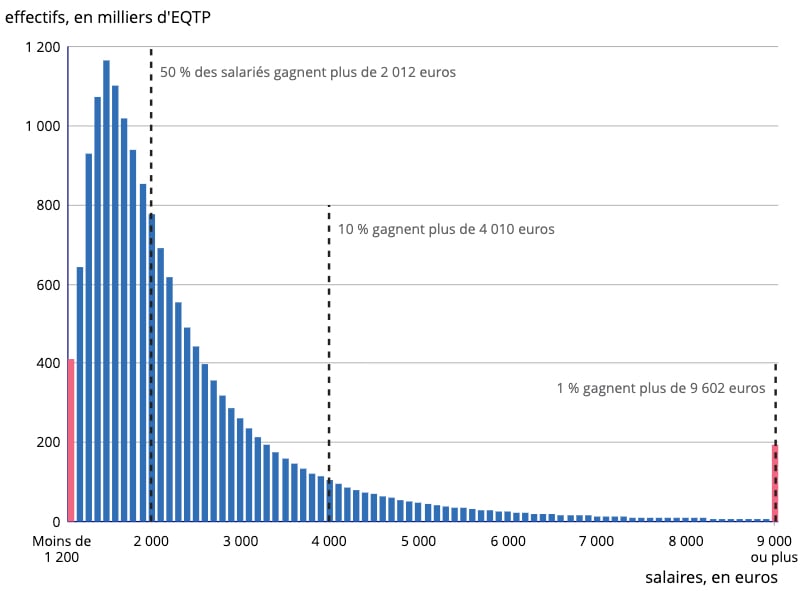
Be careful, however, not to confuse average and median, especially for the salary scale: if the average is 2520 euros net in 2021, in the private sector, the median is 2010 euros. Translation? 50% of French employees in the private sector earn more than 2010 euros, the other half receive less. Here are the details of the medians between men and women.
| Women | Men | Together | |
| The 10% earning the least | 1,340 | 1,400 | 1,370 |
| median | 1,890 | 2,100 | 2010 |
| Top 10% Earners | 3,580 | 4,320 | 4,010 |
Source: Insee, Revenues, 2023 edition – end of 2021 data
Median net salary: 2010 euros
Source: INSEE. The highest blue bar, for those who earn between 1,500 and 1,599 euros net, concerns 1.16 million salaries.
2012euros net salary per month: do you earn more than half of the French?
Median salaries: 3510 euros for executives
As soon as it is a question of average representing a high remuneration, the median is much more revealing of the reality on the ground. Illustration for executives: the median (50% of executives earn more, 50% earn less) is 3,510 euros, far from the 4,330 euros net monthly average. And the 10% of executives at the bottom of the salary scale only see an average amount of 2160 euros on their payslip.
| Frames | Intermediate professions | Employees | Workers | |
| The 10% earning the least | 2,160 | 1,560 | 1,300 | 1,310 |
| median | 3,510 | 2,270 | 1,650 | 1,760 |
| Top 10% Earners | 6,830 | 3,450 | 2,440 | 2,520 |
Executives: including salaried company directors
Source: Insee, Revenues, 2023 edition – end of 2021 data
1600euros 24 years… 3000euros 55 years
Unsurprisingly, wages climb over the years. Under 25, the average net full-time equivalent salary is 1,640 euros. Which obviously constitutes a large gap with the average 40 years pass: 2720euros per month, net, on average.
| age | Together |
| Under 25 | 1,640 |
| From 25 to 39 years old | 2,280 |
| From 40 to 49 years old | 2,720 |
| From 50 to 54 years old | 2,830 |
| 55 or older | 2,990 |
| Together | 2,520 |
Salaries at the end of 2021 – source Insee
Civil service: 2440 euros for civil servants, 1950 euros on average for non-civil servants
All statuses combined (civil servants or not), a public service employee earns on average in full-time equivalent 2380 euros net per month, advances INSEE in the annual edition of its study Employment, unemployment, income from work. This average hides significant disparities according to status, category and public service concerned (hospital, local authorities, etc.). As a reminder, the State civil service includes the central services of the ministers but also teachers (universities, high schools, colleges, etc.), for example.
| Within the public service | net salary per month |
| Officials | 2,440 |
| Category A | 3,010 |
| Category B | 2,510 |
| Category C | 1,910 |
| Non-civil servants | 1,950 |
| Together | 2,380 |
| Hospital public service | 2460 |
| Territorial public service | 2020 |
| State civil service | 2640 |
| of which teachers | 2,700 |
Insee data at the end of 2020
Minimum wage: these sectors where wages are often at a minimum
41.7%. In accommodation and catering, the automatic rise in the Smic on January 1, 2022 benefited more than 4 out of 10 employees. On the one hand, this shows that the automatic increases in the Smic are beneficial to employees in certain sectors. On the other hand, these statistics indirectly make it possible to point out the sectors which pay massively the legal minimum.
| Increase in the Smic: in each sector, what share of wages benefits? | |
| Manufacturing industry | 7.3% |
| Energy production and distribution | 0.5% |
| Water, waste and depollution management | 5.8% |
| Construction | 8.8% |
| Automobile trade and repair | 19.2% |
| Transportation | 13.5% |
| Accommodation and catering | 41.7% |
| Information and communication | 2.3% |
| Finance, banking, insurance | 2.9% |
| Real estate | 10.4% |
| Scientific and technical activities | 4.6% |
| Administrative services | 19.3% |
| Education (excluding public education) | 9.8% |
| Human health and social action | 21.3% |
| Arts, entertainment and recreational activities | 13.8% |
| According to the size of the company, and according to the type of work | |
| 1 9 wages | 24.5% |
| 10 or more salaries | 12.2% |
| Part-time | 29.5% |
Source: Insee, Employment, unemployment, earned income, 2023 edition
Based on the revaluation of January 1, 2022.
Those rare departments where you earn more than average
Who says average, says figure boosted by very high salaries. Where do those who receive the most cash each month live? Only a few departments are comfortably above the national averageof 2520euros net per month: THE Rhine (+5%)Essonne (+8%), Seine-Saint-Denis (+10.5%), Val-de-Marne (+11.5%), Yvelines (+21.2%), Paris (+42.5%) and Hauts-de-Seine (+58%). In the 92the average wage – and not the median wage – in the private sector therefore flirts with 4000 euros per month.
| Departments | deviation from the national average |
| Aïn | -8.9% |
| aisne | -16.4% |
| Combine | -18.2% |
| Alpes de Haute Provence | -17.7% |
| High mountains | -19.5% |
| Alpes-Maritimes | -1.8% |
| Arche | -15.9% |
| Ardennes | -14.9% |
| Arige | -19.6% |
| Dawn | -15.2% |
| Aude | -20.8% |
| Aveyron | -17.7% |
| Bouches-du-Rhne | -1.3% |
| Calvados | -14.3% |
| Cantal | -22.3% |
| Charente | -13.2% |
| Charente Maritime | -17.5% |
| Dear | -13.6% |
| Corrze | -18.4% |
| Cte-d’Or | -9.8% |
| Ctes-d’Armor | -16.8% |
| Dig | -22.8% |
| Dordogne | -20.1% |
| Doubs | -11.7% |
| Drm | -9.9% |
| Eure | -10.6% |
| Eure-et-Loir | -11.8% |
| finister | -13.9% |
| South Corsica | -14.1% |
| Upper Corsica | -17.0% |
| Gard | -12.7% |
| Upper Garonne | +1.9% |
| Gers | -20.2% |
| Gironde | -6.0% |
| Hrault | -11.2% |
| Ille-et-Vilaine | -8.8% |
| Indre | -18.4% |
| Indre et Loire | -10.5% |
| isre | +0.1% |
| Jura | -13.7% |
| Landes | -17.5% |
| Loir et Cher | -14.3% |
| Loire | -10.6% |
| Upper Loire | -19.2% |
| Loire Atlantique | -6.3% |
| Loiret | -9.3% |
| Batch | -17.7% |
| Lot et Garonne | -18.7% |
| Lozre | -23.0% |
| Maine et Loire | -14.0% |
| Sleeve | -13.6% |
| Marl | -9.2% |
| Haute Marne | -17.9% |
| Mayenne | -14.5% |
| Meurthe et Moselle | -11.1% |
| Meuse | -16.2% |
| Morbihan | -16.0% |
| Moselle | -12.4% |
| Nivre | -19.0% |
| North | -7.3% |
| oise | -9.8% |
| adorns | -18.8% |
| Pas-de-Calais | -16.3% |
| Puy de Dme | -7.9% |
| Pyrenees-Atlantiques | -10.6% |
| Hautes-Pyrnes | -19.0% |
| Pyrenees-Orientales | -18.7% |
| Lower Rhine | -5.8% |
| Upper Rhine | -9.1% |
| Rhne metropolis of Lyon | 5.0% |
| Upper Sane | -17.7% |
| Sane et Loire | -13.4% |
| Sarthe | -14.4% |
| Savoy | -7.9% |
| Haute-Savoie | -5.3% |
| Paris | +42.5% |
| Seine Maritime | -7.1% |
| Seine et Marne | -5.2% |
| Yvelines | +21.2% |
| Two-Svres | -10.4% |
| Sum | -14.0% |
| Tarn | -15.4% |
| Tarn et Garonne | -17.9% |
| Var | -14.7% |
| Vaucluse | -13.9% |
| sell | -16.9% |
| Vienna | -15.4% |
| Haute-Vienne | -14.9% |
| Vosges | -16.2% |
| Yonne | -16.3% |
| Territory-of-Belfort | -3.1% |
| Essone | +8.0% |
| Hauts-de-Seine | +58.0% |
| Seine-Saint-Denis | +10.2% |
| Val de Marne | +11.5% |
| Val d’Oise | -0.7% |
| Guadeloupe | -9.7% |
| Martinique | -10.3% |
| Guyana | -7.4% |
| Reunion | -15.7% |
Source: INSEE. Salaries in EQTP in the private sector at departmental level in 2021.
How to read this table? In 2021, in Paris, in the private sector, the average full-time equivalent salary (EQTP) exceeds the national average by 42.5%.
Bonus: In Europe, are the French badly off?
22.9 euros. Here is, gross, the average net hourly wage in the European Union. Is France doing better? Yes with a average hourly wage of 28.6 euros. Insee insists in this European comparison on social contributions, which represent 12.5 euros per hour, above the 8.5 euros in the euro zone. But France is not the greediest in contributions: it is Sweden with 13.9 euros on average per hour. France occupies the 5th position of the countries with the highest hourly costs (41.1 euros), Germany the 6th position (40.0 euros), raises the INSEE.
| Hourly cost of labor in 2022 | Average gross hourly wage and salary in 2022 | |
| Bulgaria | 8.0 | 7.0 |
| Romania | 9.3 | 8.8 |
| Hungary | 11.1 | 9.4 |
| Croatia | 11.9 | 10.2 |
| Poland | 12.2 | 10.1 |
| Latvia | 12.4 | 9.8 |
| Lithuania | 13.2 | 12.4 |
| Malta | 13.5 | 13.0 |
| Greece | 15.2 | 12.0 |
| Portugal | 15.3 | 12.3 |
| Slovakia | 15.7 | 11.5 |
| Czech Republic | 16.2 | 12.4 |
| Estonia | 16.6 | 12.3 |
| Cyprus | 17.8 | 14.6 |
| Spain | 22.9 | 17.0 |
| Slovenia | 23.5 | 20.1 |
| Italy | 28.4 | 20.4 |
| Ireland | 36.1 | 30.5 |
| Finland | 37.1 | 30.5 |
| The Netherlands | 39.1 | 30.0 |
| Austria | 39.3 | 28.7 |
| Germany | 40.0 | 31.1 |
| France | 41.1 | 28.6 |
| Sweden | 43.2 | 29.2 |
| Belgium | 43.3 | 31.8 |
| Denmark | 48.4 | 42.6 |
| Luxemburg | 50.4 | 43.7 |
| Eurozone | 34.1 | 25.6 |
| european union | 30.2 | 22.9 |
Where are you located in France? And in your sector?
For the past 2 years, INSEE has been offering a interactive tool allowing you to gauge your salary within the French scale, in your sector, etc. One caveat: this test tool hasn’t been updated for 2 years, still giving you 2019 data.
Net salary: how many employees earn more or less than you?