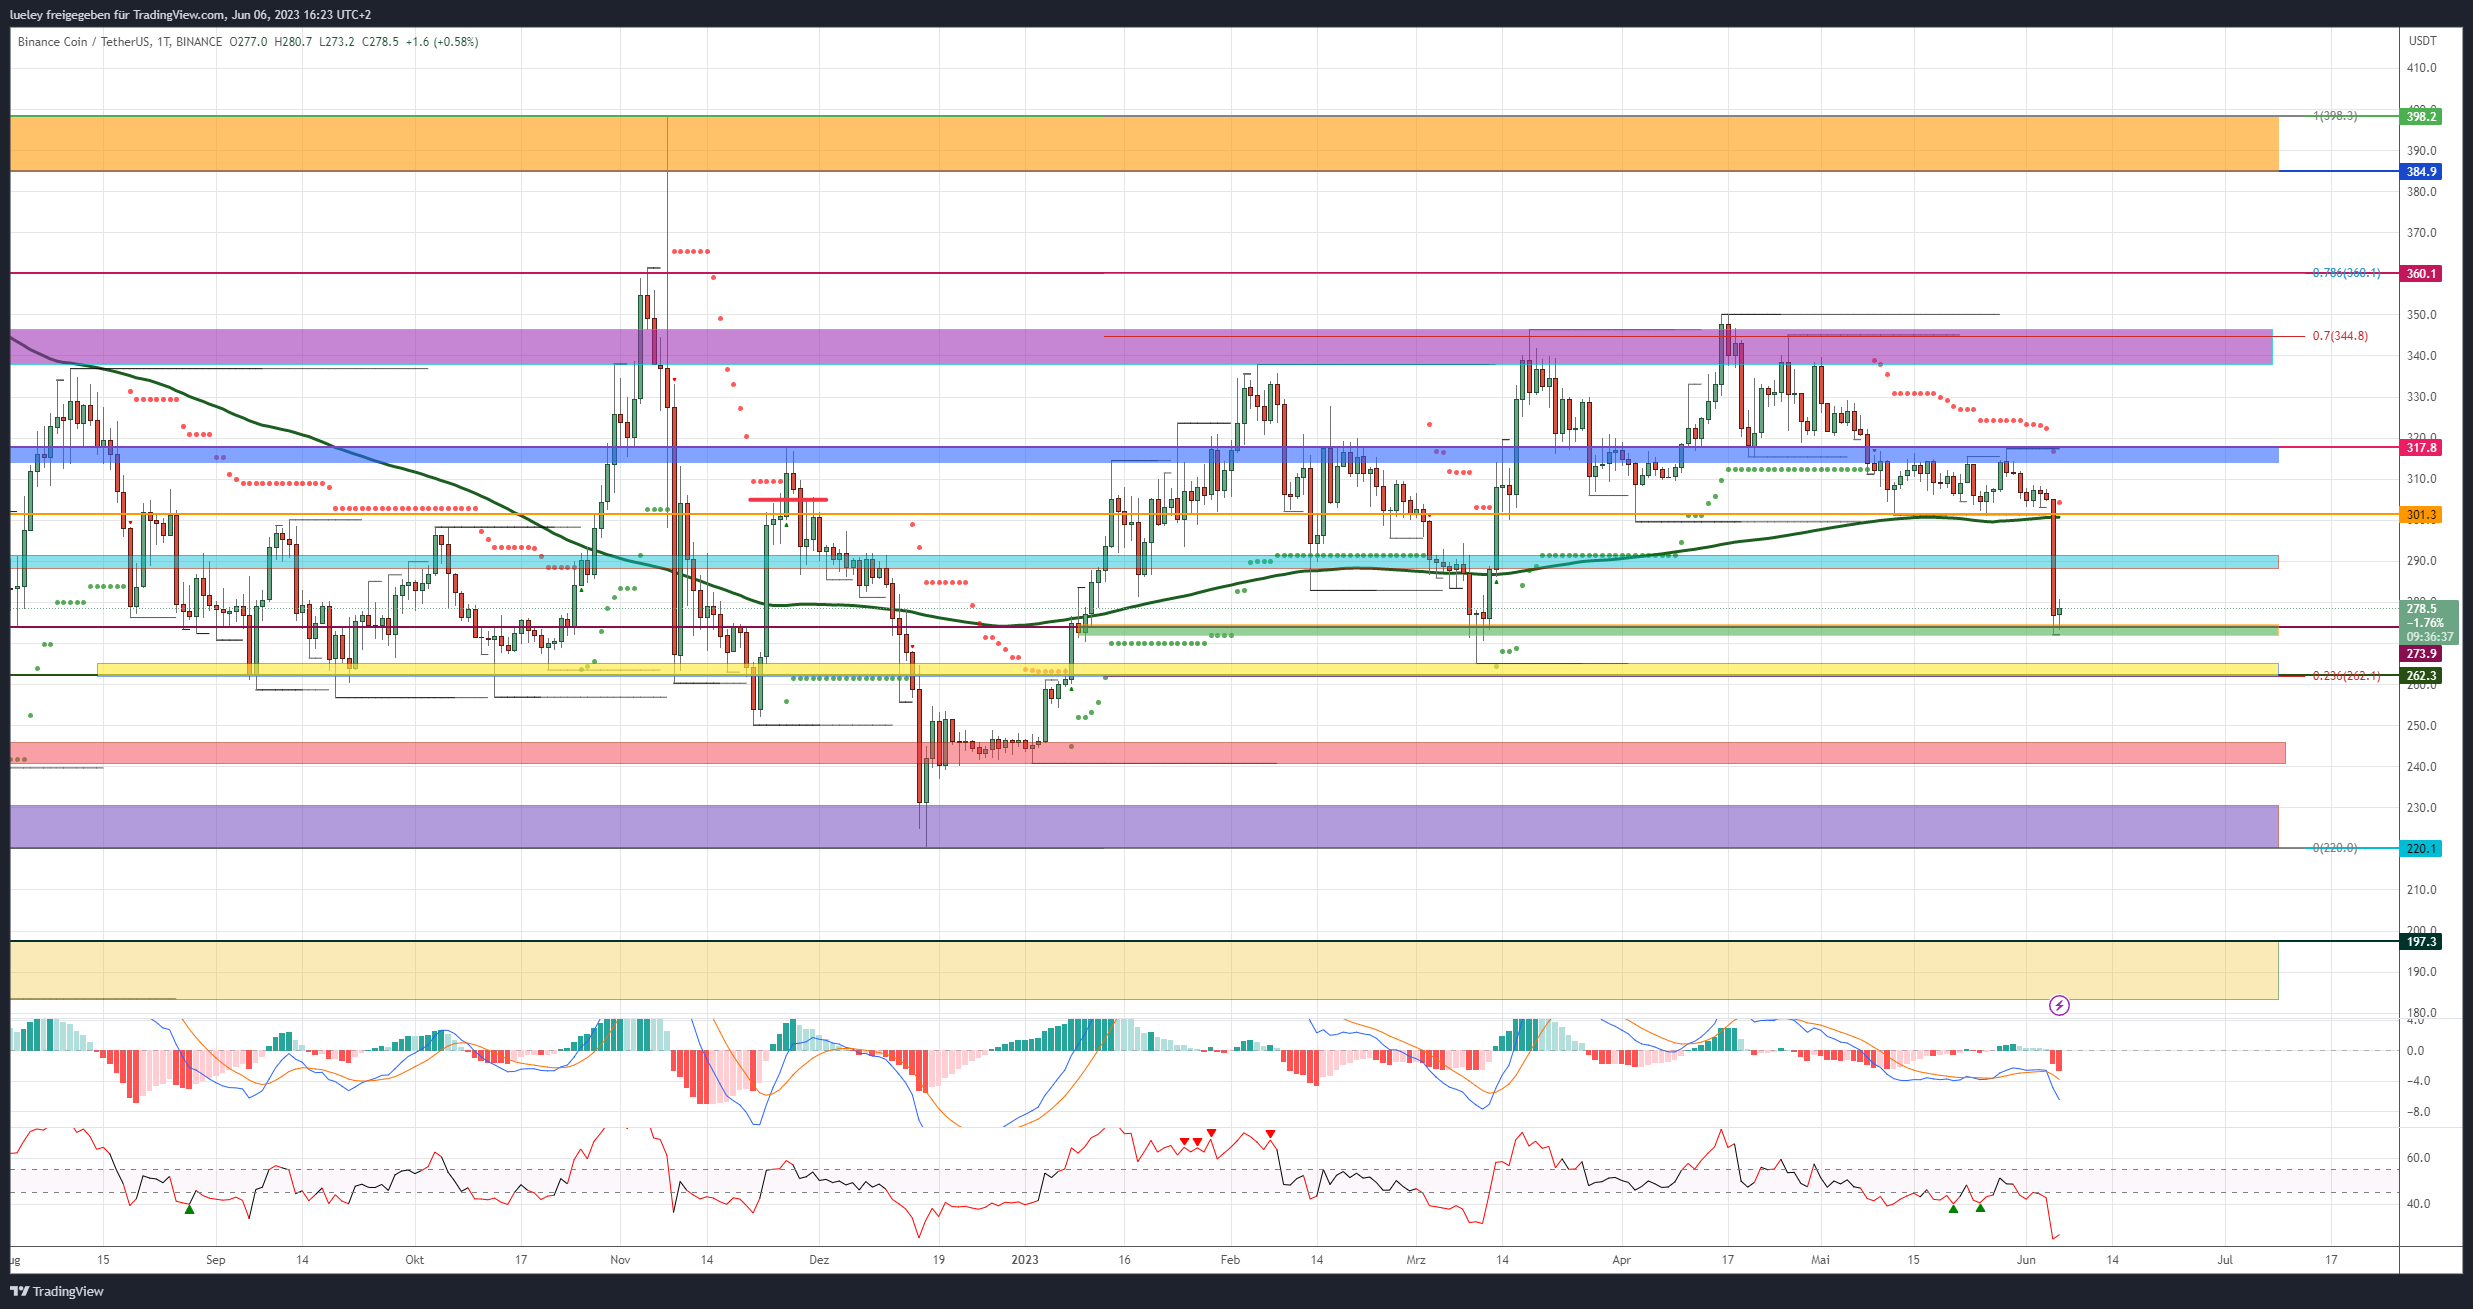
The Binance Coin (BNB) price is tumbling south in the wake of the latest SEC allegations against the world’s largest crypto exchange Binance. The BNB price subsequently broke through the support area at 301 US dollars and fell by a good 10 percent to 272 US dollars in the meantime. Investors were clearly upset that the Securities and Exchange Commission, in its lawsuit, described Binance Coin as an unregistered security along with more than 60 other cryptocurrencies. Significantly, an investor opened a $20 million short position on BNB just hours before the latest bad news. Insider trading cannot be ruled out here. Although the BNB price was able to stabilize at least in the area of the last bottoming zone from March 2023, the chart still looks clearly battered. A relapse to the striking low of March 10 at 265 US dollars is therefore becoming increasingly likely. This support mark now represents the make-or-break area on the underside. Only when the Binance Coin can sustainably recapture the key mark of 301 US dollars would the risk of further price setbacks be eliminated.
BNB: Bullish price targets for the coming weeks
Bullish price targets: $290, 301 USD, 314/318 USD, $338/346$360, 385/$398
After the sensitive price slump at the beginning of the week, the BNB price is currently stabilizing above the green support zone at 278 US dollars. Even if the price of the Binance Coin can continue to recover in the short term, the first technical chart hurdle is already waiting at 290 US dollars. In view of the bearish news situation, the buyer side ideally has to recapture the turquoise zone directly in order to be able to target yesterday’s demolition edge at 301 US dollars again.
In the area just above 300 US dollars there is now a whole bundle of resistance. In addition to the supertrend, the unweighted moving average line MA200 (green) can also be found here, which acted as a strong support in the previous month of May. A price bounce to the south seems very likely for the time being due to the uncertainty on the market. If, contrary to expectations, the bulls succeed in a dynamic reconquest, a subsequent recovery towards the last highs around US$314 would be conceivable.
The BNB price was able to overcome this chart mark several times at the end of the day. Only if the blue resist zone can be breached sustainably would a new upward movement in the direction of the annual highs around the 70 Fibonacci retracement be considered at all.
In order to even be able to approach its maximum price targets for the coming months, the overall market would have to recover sustainably to the north. Only in the event of a strong bullish breakout to new annual highs would an increase in the BNB price to the 78 Fibonacci retracement at USD 360 and the maximum price target range that can be derived around the November high at USD 398 be imaginable.
BNB: Bearish price targets for the coming weeks
Bearish price targets: $273, 265 USD, 245/241 USD, 231/220 $197/$183
The bears achieved a points victory through yesterday’s sell-off. The chart image of the Binance Coin has turned in favor of the seller side for the time being. The probability of an extension of the correction in the direction of the annual low of January 2nd increases significantly at the latest when the yellow support zone is abandoned by 265 US dollars. The buyer side must be there to avert a sell-off towards $245.
If the BNB price falls back into the red support zone, a first important price target on the seller’s side would have been completed. In the short term, the Binance Coin should stabilize here. However, if further negative details about the largest crypto exchange come to light in the near future and the key crypto currency Bitcoin also weakens, the likelihood of a sustained correction at BNB will also increase.
The price of the Binance coin is then likely to drop to the purple support zone from December 2022. The first buyers are likely to come back onto the floor here and ensure price stabilization. However, should the crypto market come under more sustained pressure in the second half of the year, a correction to the maximum bearish target range of between USD 197 and USD 183 cannot be ruled out. This support zone is derived from last year’s summer low.
Looking at the indicators
The RSI is now clearly oversold at a value of 26 on a daily basis due to yesterday’s sell-off. The MACD indicator also has a fresh sell-signal below the 0-line, but there is still room to go down. Both indicators are also turned short in the weekly chart, which corresponds to the bearish scenario. Only when the RSI in the daily chart can generate a fresh buy signal and there are signs of a bottom formation on a weekly basis will the Binance Coin switch back to calmer waters.
Disclaimer: The price estimates presented on this page do not represent buy or sell recommendations. They are merely an assessment by the analyst.
The chart images were created using TradingView created.
USD/EUR exchange rate at the time of going to press: EUR 0.93.
The latest issues of BTC-ECHO Magazine
You might also be interested in this