
After briefly passing the capital level of $45,000, Bitcoin violently reenters its range and falls back below $40,000. Simple jolt to get buyers out or real danger? Let’s try to decipher the latest movements in this new article!
This technical analysis is offered to you in collaboration with the Coin Trading and its algorithmic trading solution finally accessible to individuals.
Technical analysis
Bitcoin
Let’s start with an analysis of the price action (frequently called Price Action). We can easily see that the $44,500 level is the main resistance very visible ! We spent it briefly for a few days, but we reinstated very quickly.
Then, at the level of supportwe have just arrived briefly on the level of Daily Demand. This is where buyers need to activate a new bullish move, in order to avoid making a bottom lower than the previous one.
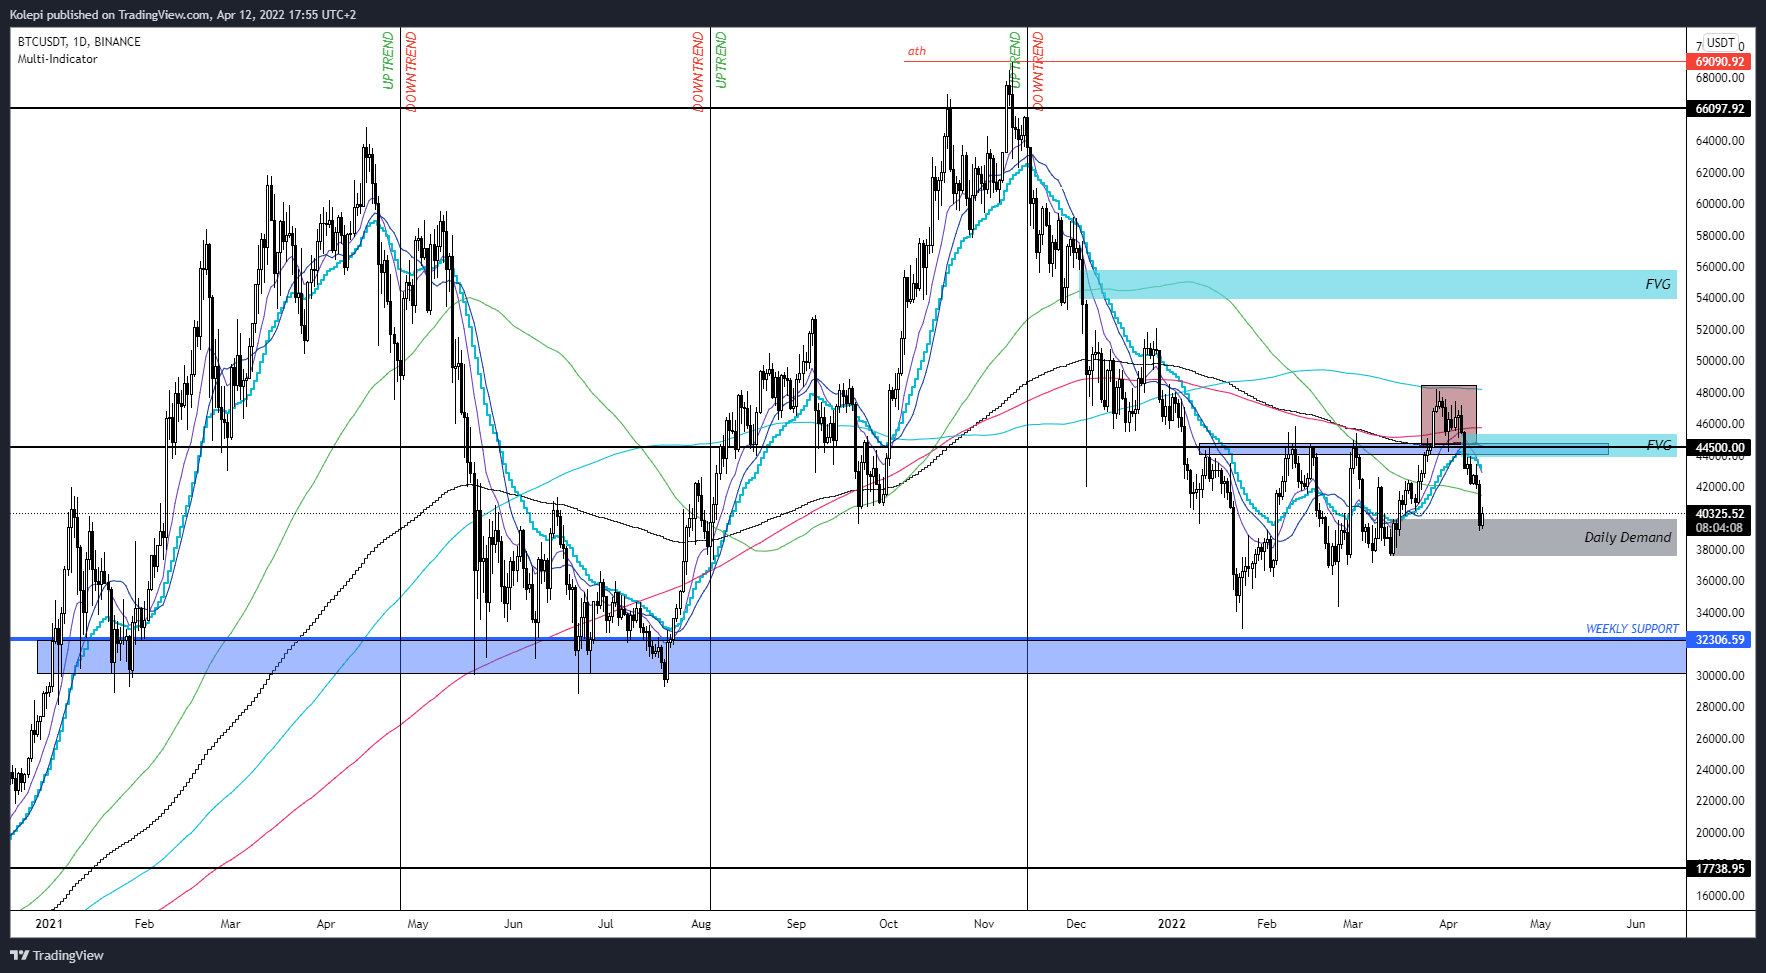
After looking at the chart without indicators, I like to activate the moving averages. I find them particularly relevant in H4 and daily for my part. Here we have a superb confluence of moving averages at the $44,500 level with a horizontal level, which increases my confidence that the $44,500 level is the crucial level to pass.
Finally, I can activate my volume profile. It is particularly interesting because the levels where the volume is concentrated are often levels that tend to react. So, we can see that the rejection we had at $48,200 was a level where a lot of volume lay. So it’s quite logical that we have a rejection here. We just got back to $40,000 and that level seems to be holding for now, there is also a lot of volume residing here. To learn more about traditional markets, I invite you to follow our macro point!
NASDAQ
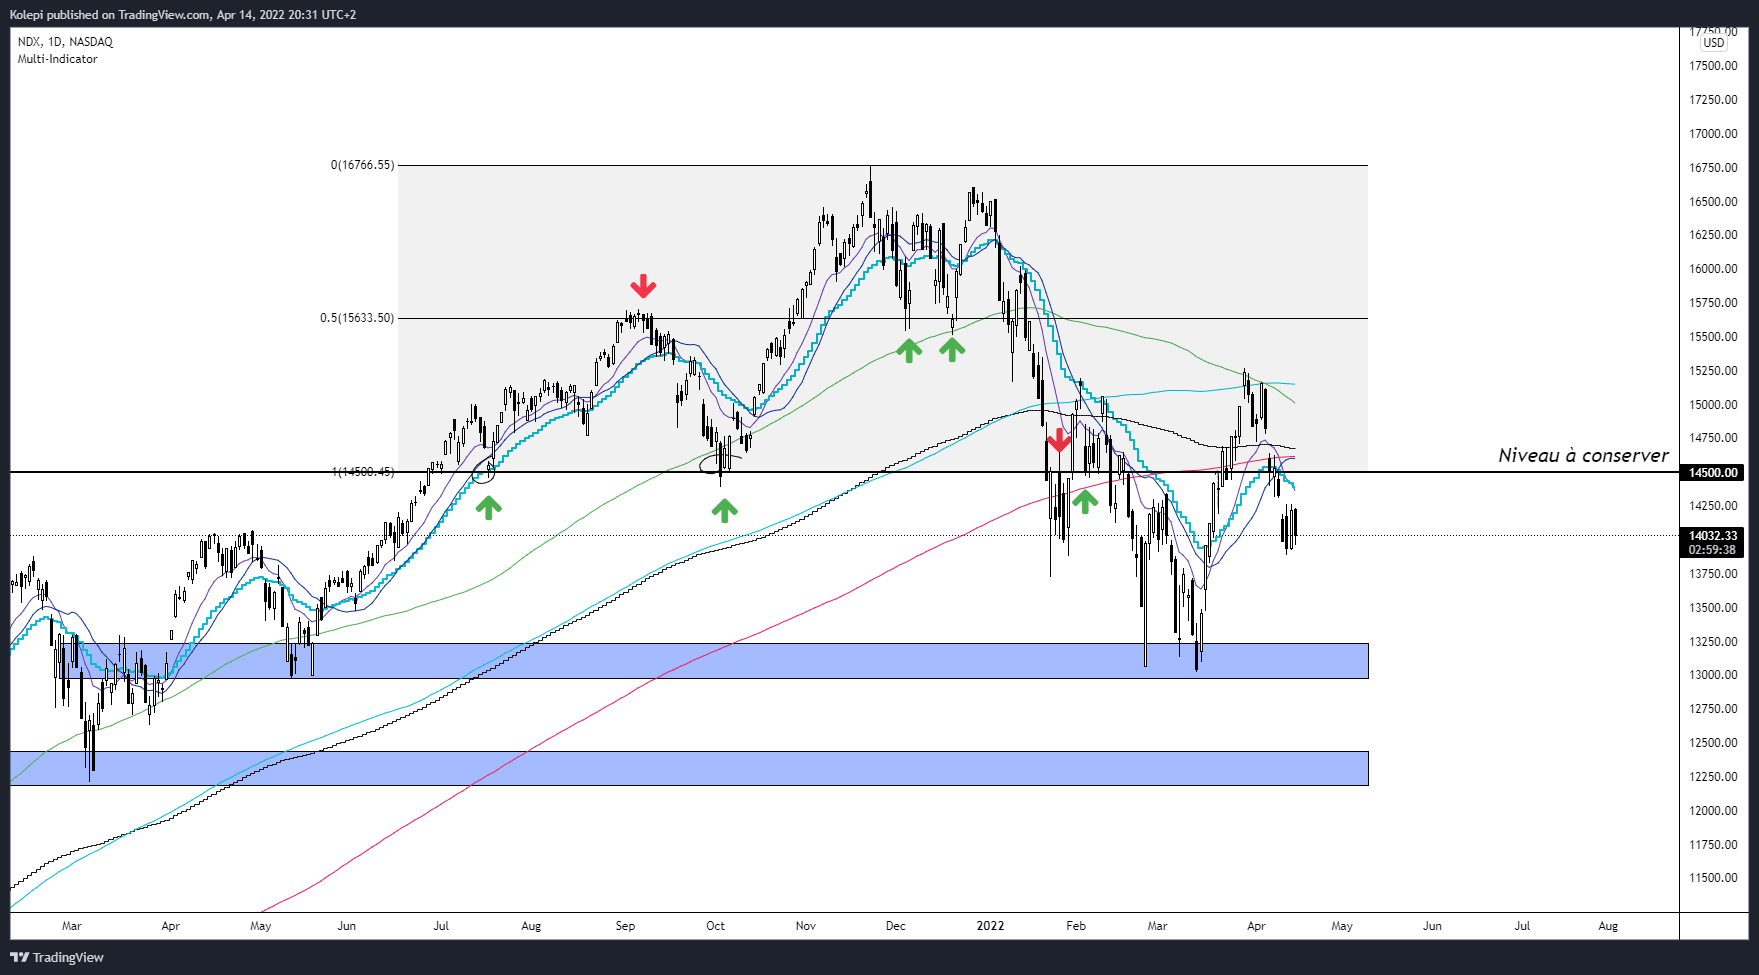
Very important to observe in cryptocurrency trading, the NASDAQ. We are, on Bitcoin, quite often correlated to NASDAQ, and altcoins are themselves correlated to Bitcoin.
The level that I thought was worth keeping was $14,500, which offered us a pivot point confluence and multiple moving averages. This level has been lost, and it should now be particularly difficult to pass, due to this confluence of several elements.
Orderflow, volume analysis, financial data.
Weekly Volume Profile
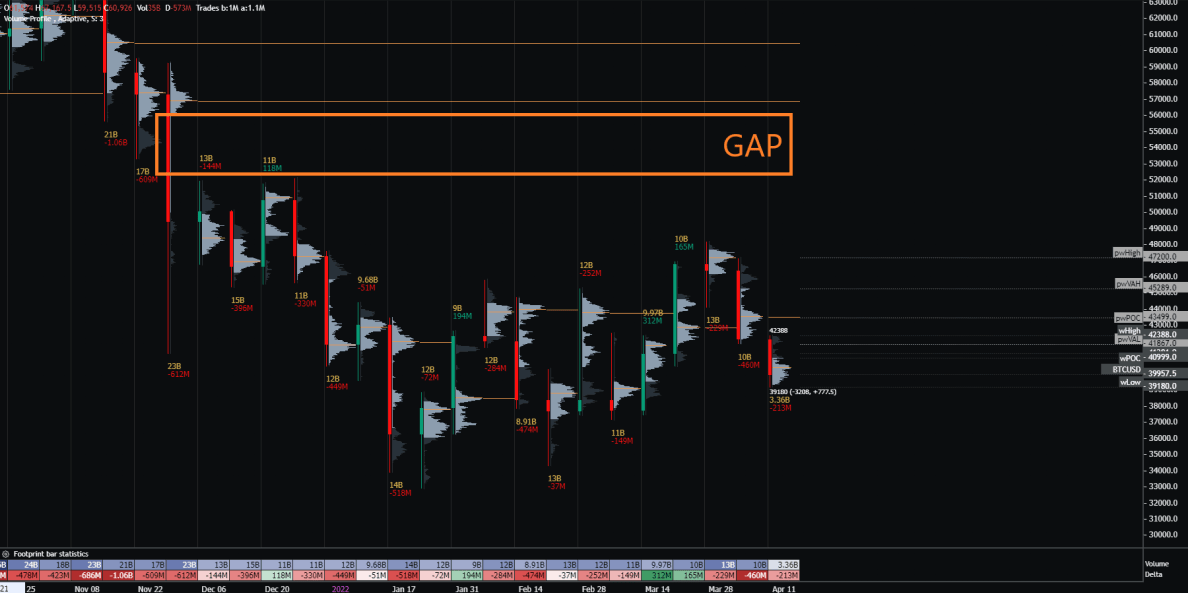
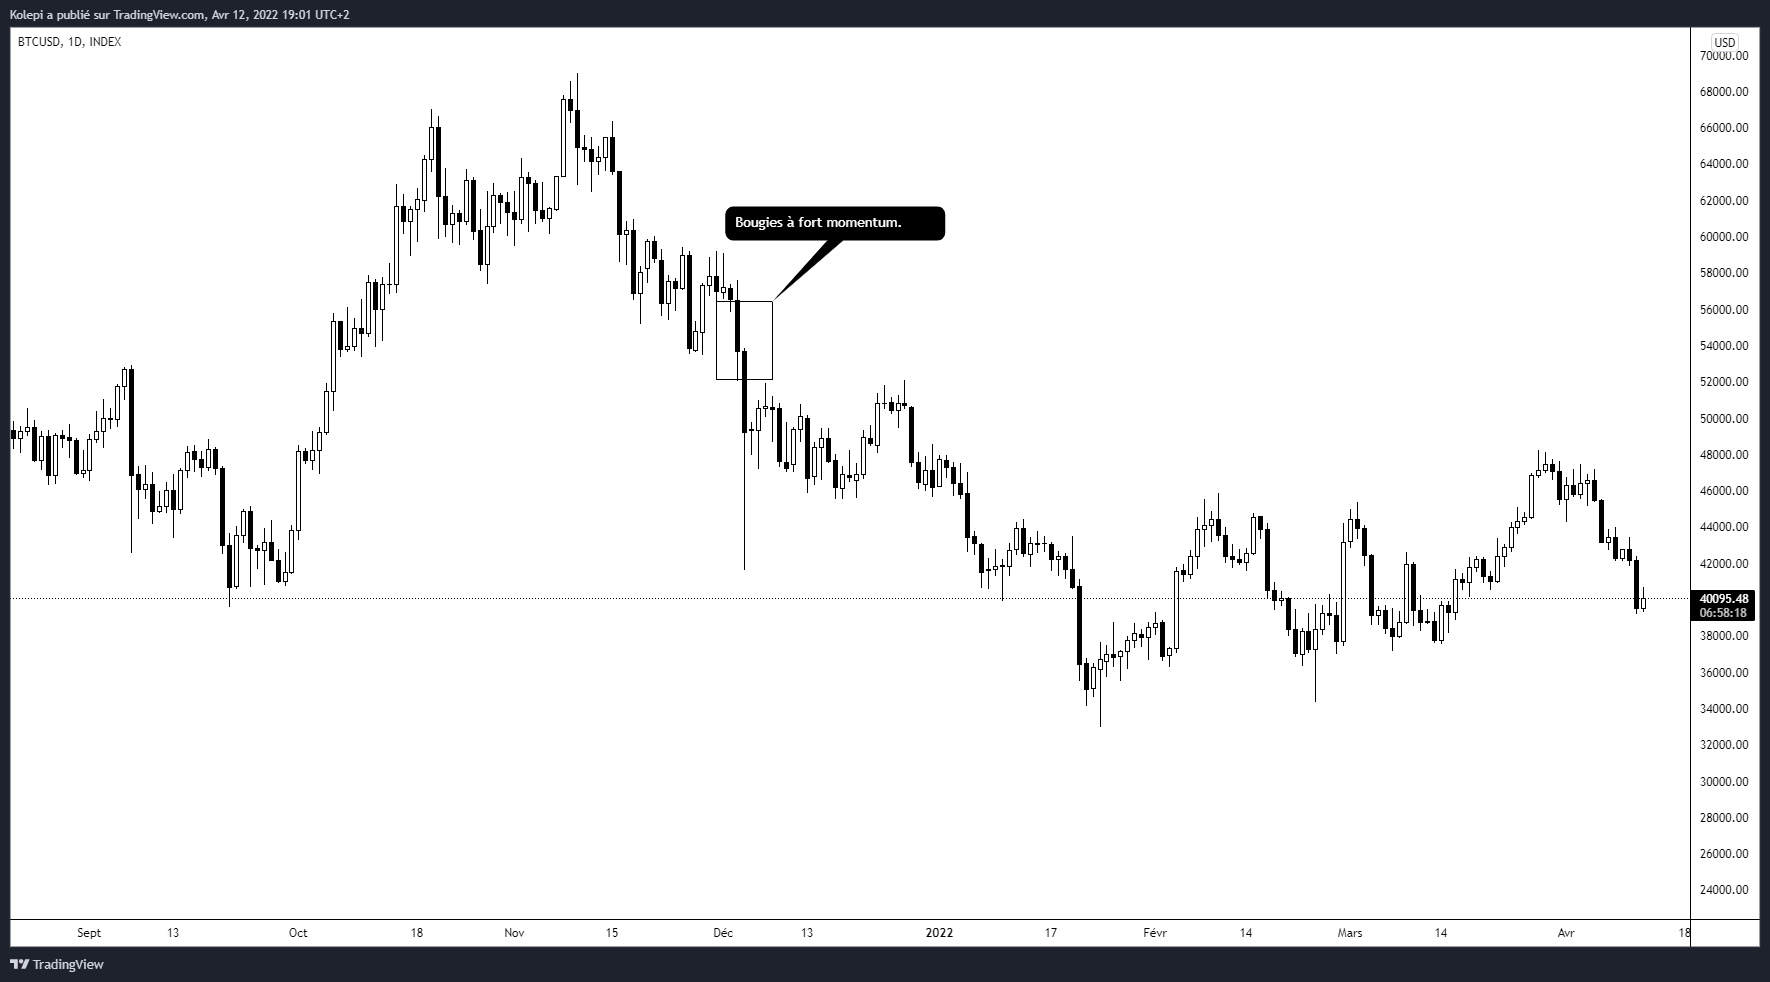
We had already spotted it in my last article on Bitcoin, but there is a volume gap between $52,000 and $55,000. These gaps are caused by high momentum candles, which do not leave the possibility of filling all orders. They generally tend to fill in over time.
open-interest
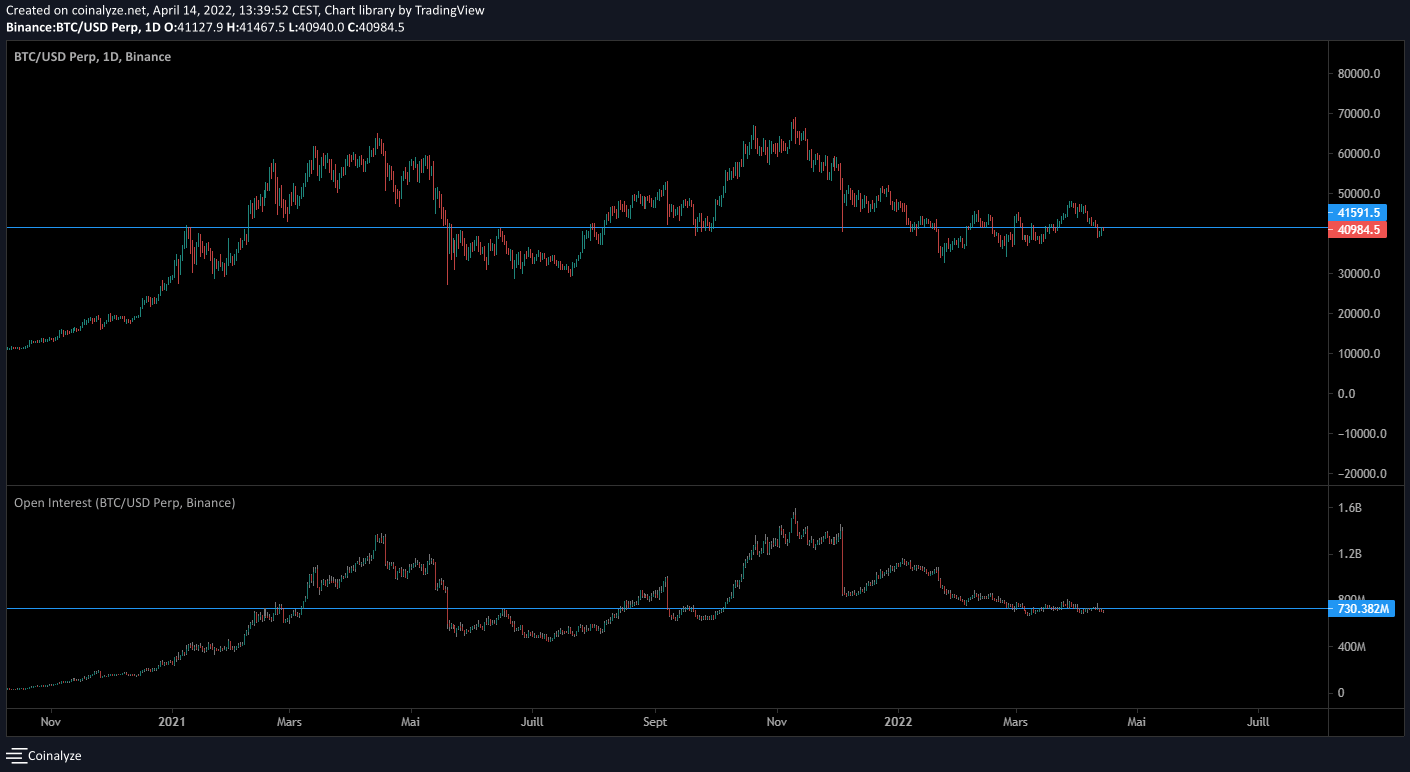
The open interest represents the total sum placed on the perpetual markets of an asset. If I place myself in the purchase of $1000 of BTC on the perpetual markets, the Open Interest increases by $1000. If I close my position, the Open Interest drops by $1000.
Thus, it allows to observe if the participants are overexposed to the leverage effect, because these contracts are generally used to trade with leverage.
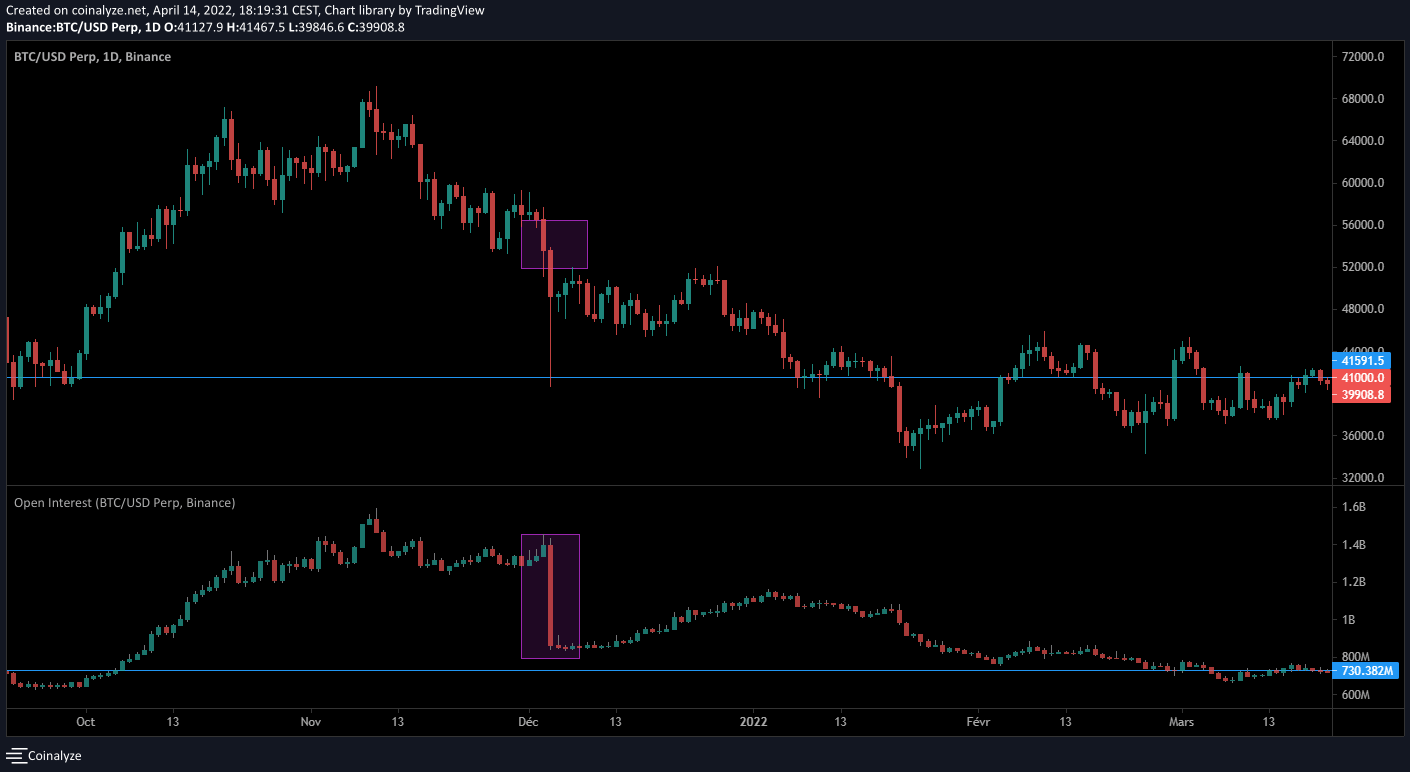
In the event of a big Bitcoin move, those overexposed with leverage can create a liquidation cascade. This is what happened in particular on this example that I have already used earlier in the article.

These high momentum candles annotated here are caused by over-leveraged traders. We can confirm this with the Open Interest which falls drastically on these candles.
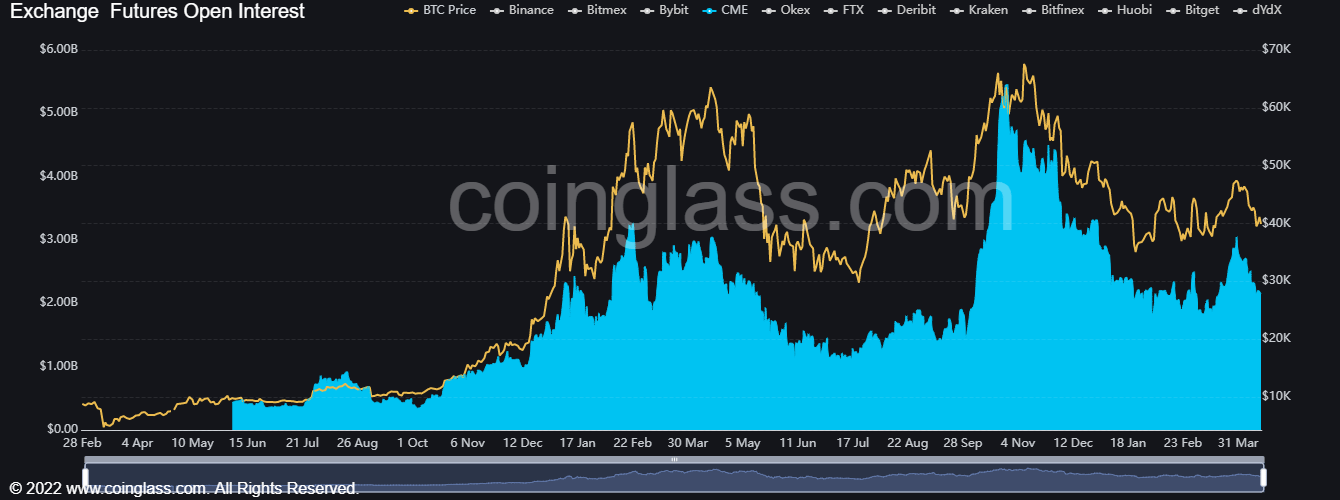
To be a little more specific: the Open Interest data of the CME (Chigago Mercantil Exchange) show us that institutional investors seem to be gradually withdrawing from their Bitcoin positions.
Options
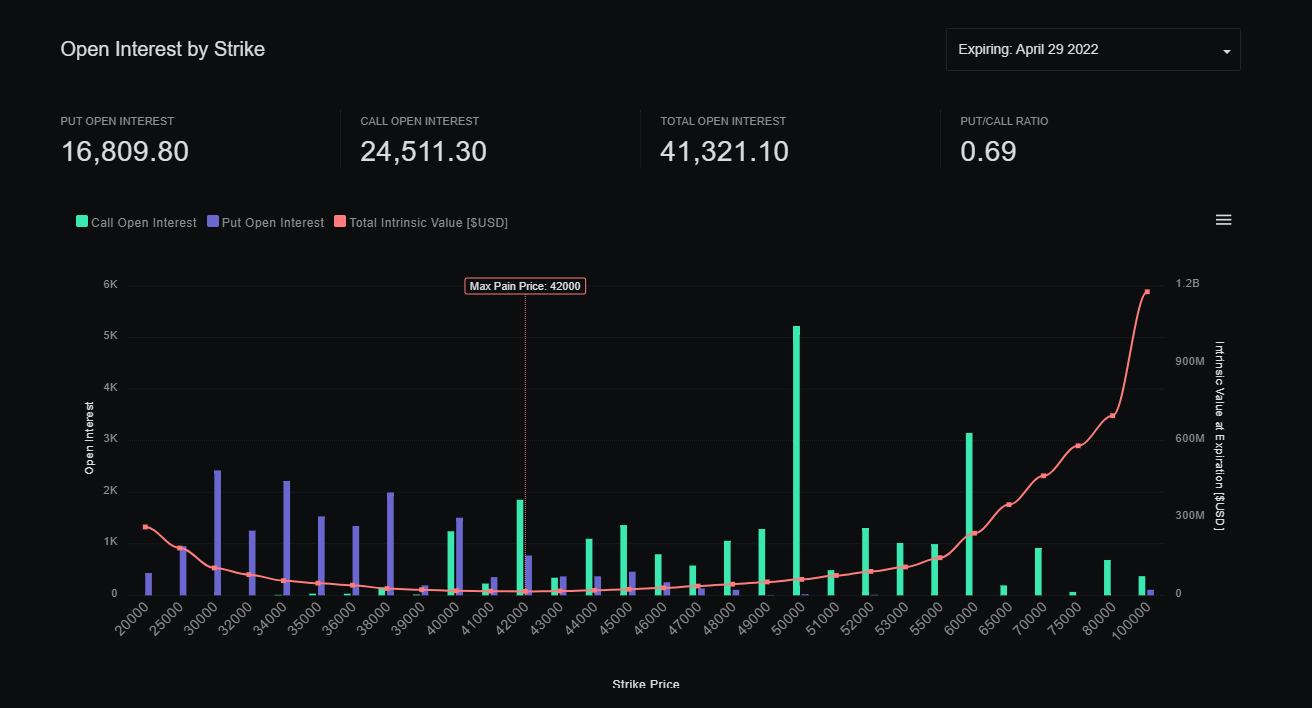
We can see that there are over 41,000 bitcoins that will expire via options contracts on April 29.
This expiry is monitored by a large number of operators. the max bread price is the price where there will be a maximum loser at expiration, it is currently at $42,000 but may still change by April 29th.
Often, as the contracts expire, the price approaches this max pain price. It is therefore relatively important to monitor it regularly!
On-chain data
Exchange Net Position Change
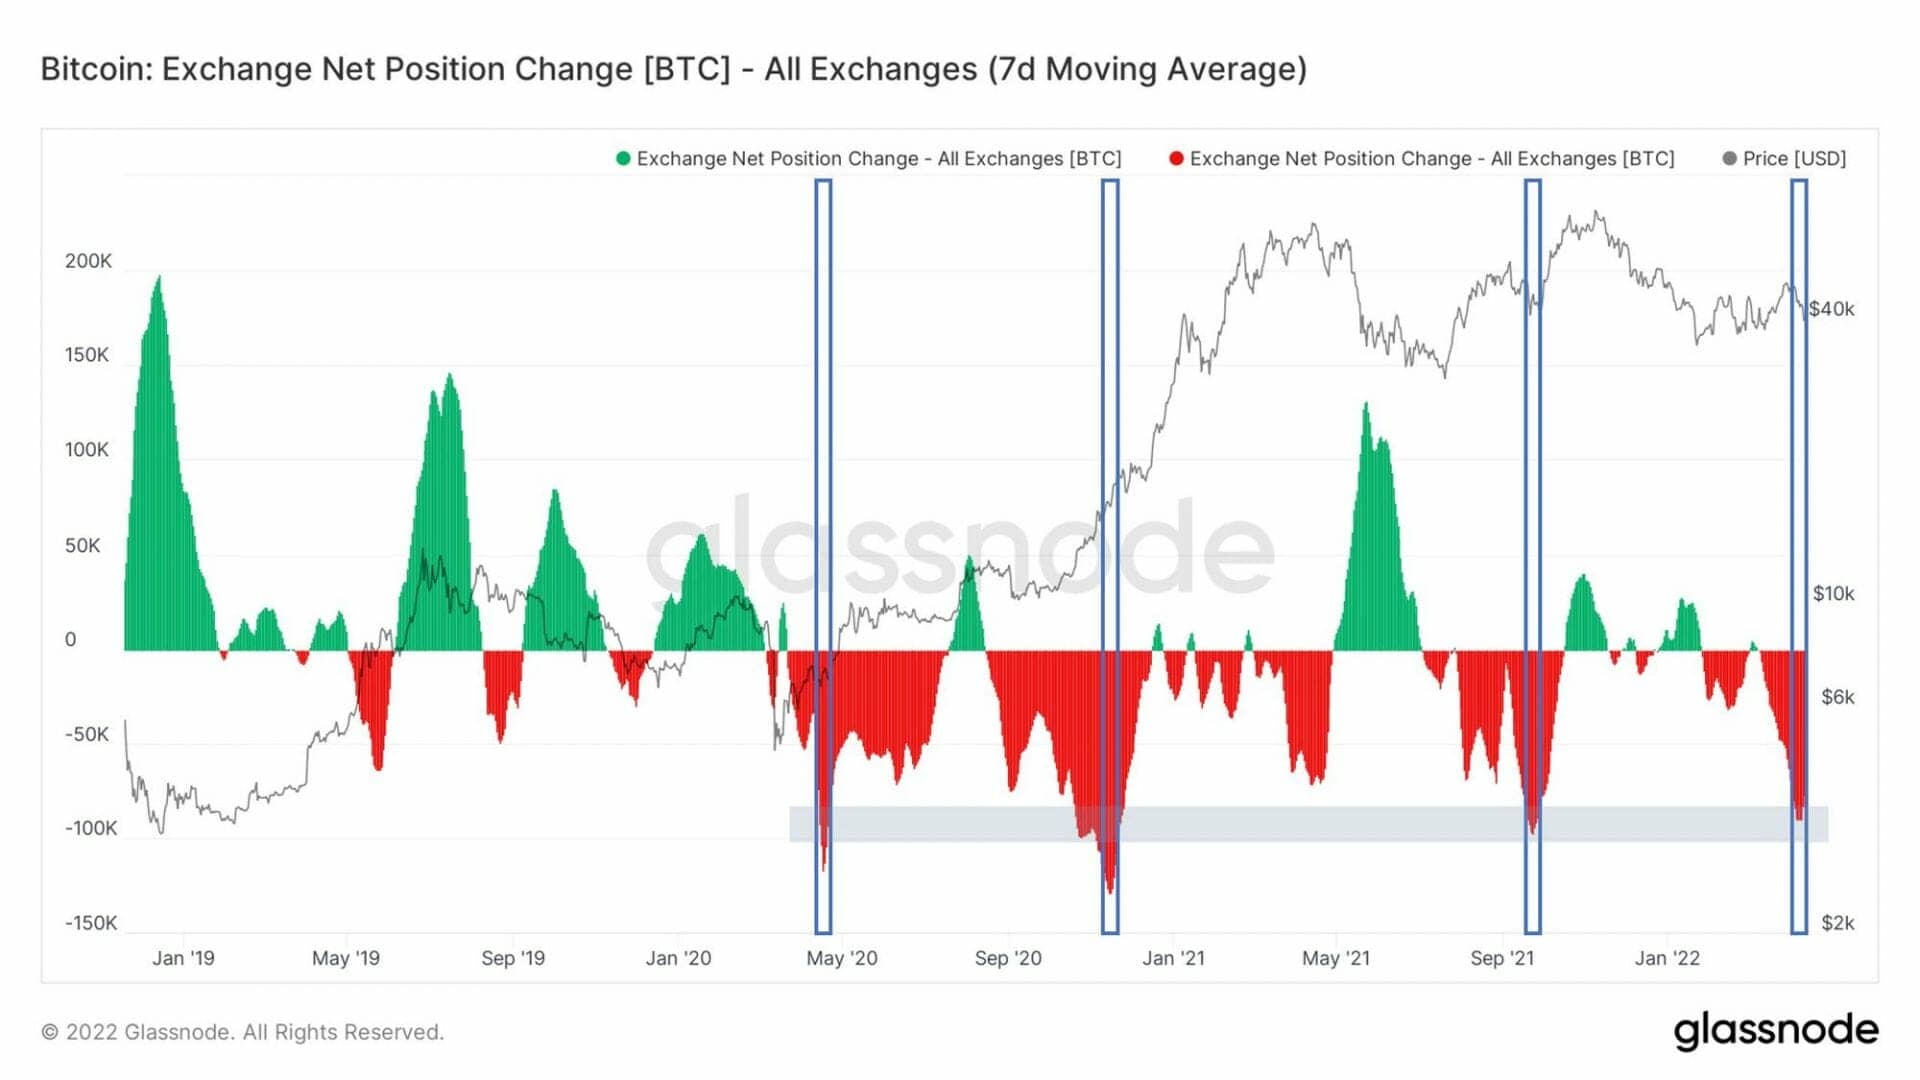
A data that I always appreciate: the amount of bitcoins entering and leaving the exchanges. I interpret it as follows:
- If a lot of bitcoins come out of exchanges, the trend is to accumulation. Bitcoins that are not on exchanges cannot be sold against fiat currency: reduction of selling pressure.
- Conversely, if a lot of bitcoins enter the exchanges, it is often with a view to selling, or at least preparing for a sale. The selling pressure increased.
We can see that the trend has largely been for accumulation off the exchanges, much like the bottoms we’ve seen over the past couple of years.
Focus on important wallets
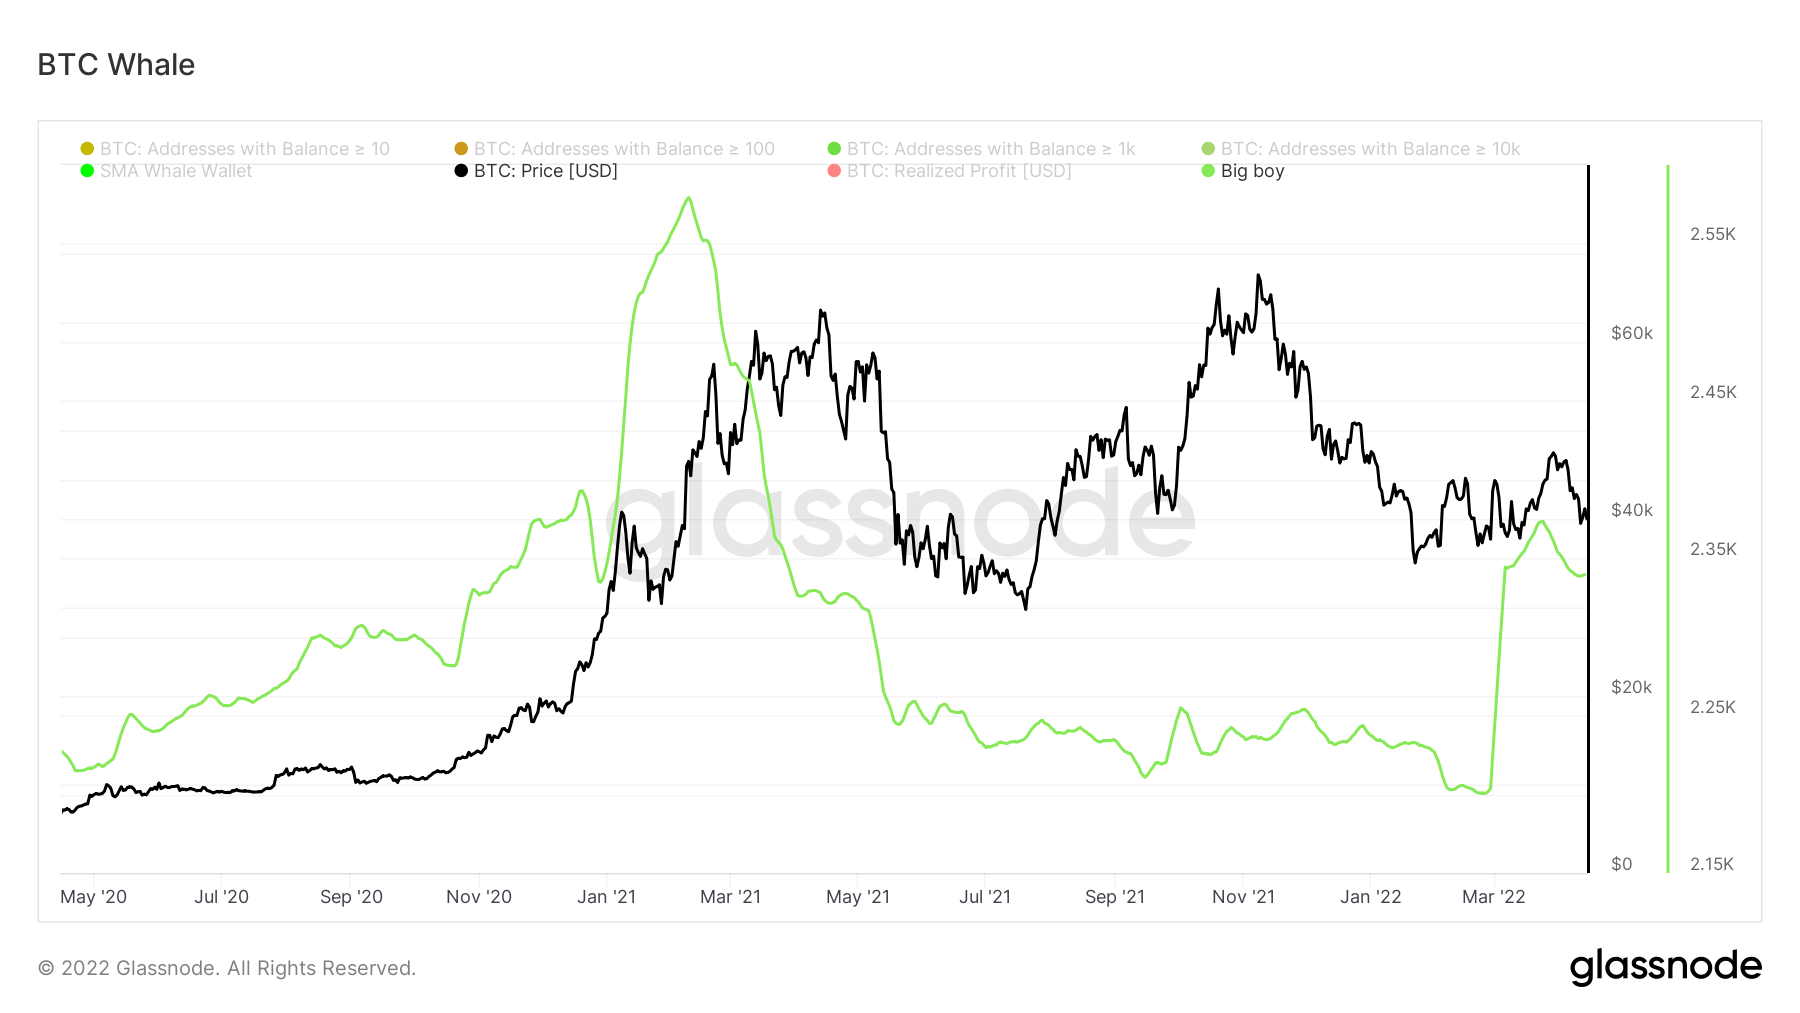
Here we have a graph representing two things: the price of Bitcoin is in black, and the green line is an average of the number of wallets holding more than 1000 or more than 10,000 bitcoins.
These portfolios are important to monitor: they are the ones that move the market significantly. A market order to sell 1000 bitcoins is felt quite quickly.
Thus, we can see that this average drastically increased from February 28 to March 8.
I take this data with a lot of tweezers, because it is common for funds from exchange portfolios (Binance, Kucoin, FTX for example) to be replaced, which can distort the interpretation that can be made of it.
Net Realized Profit & Loss
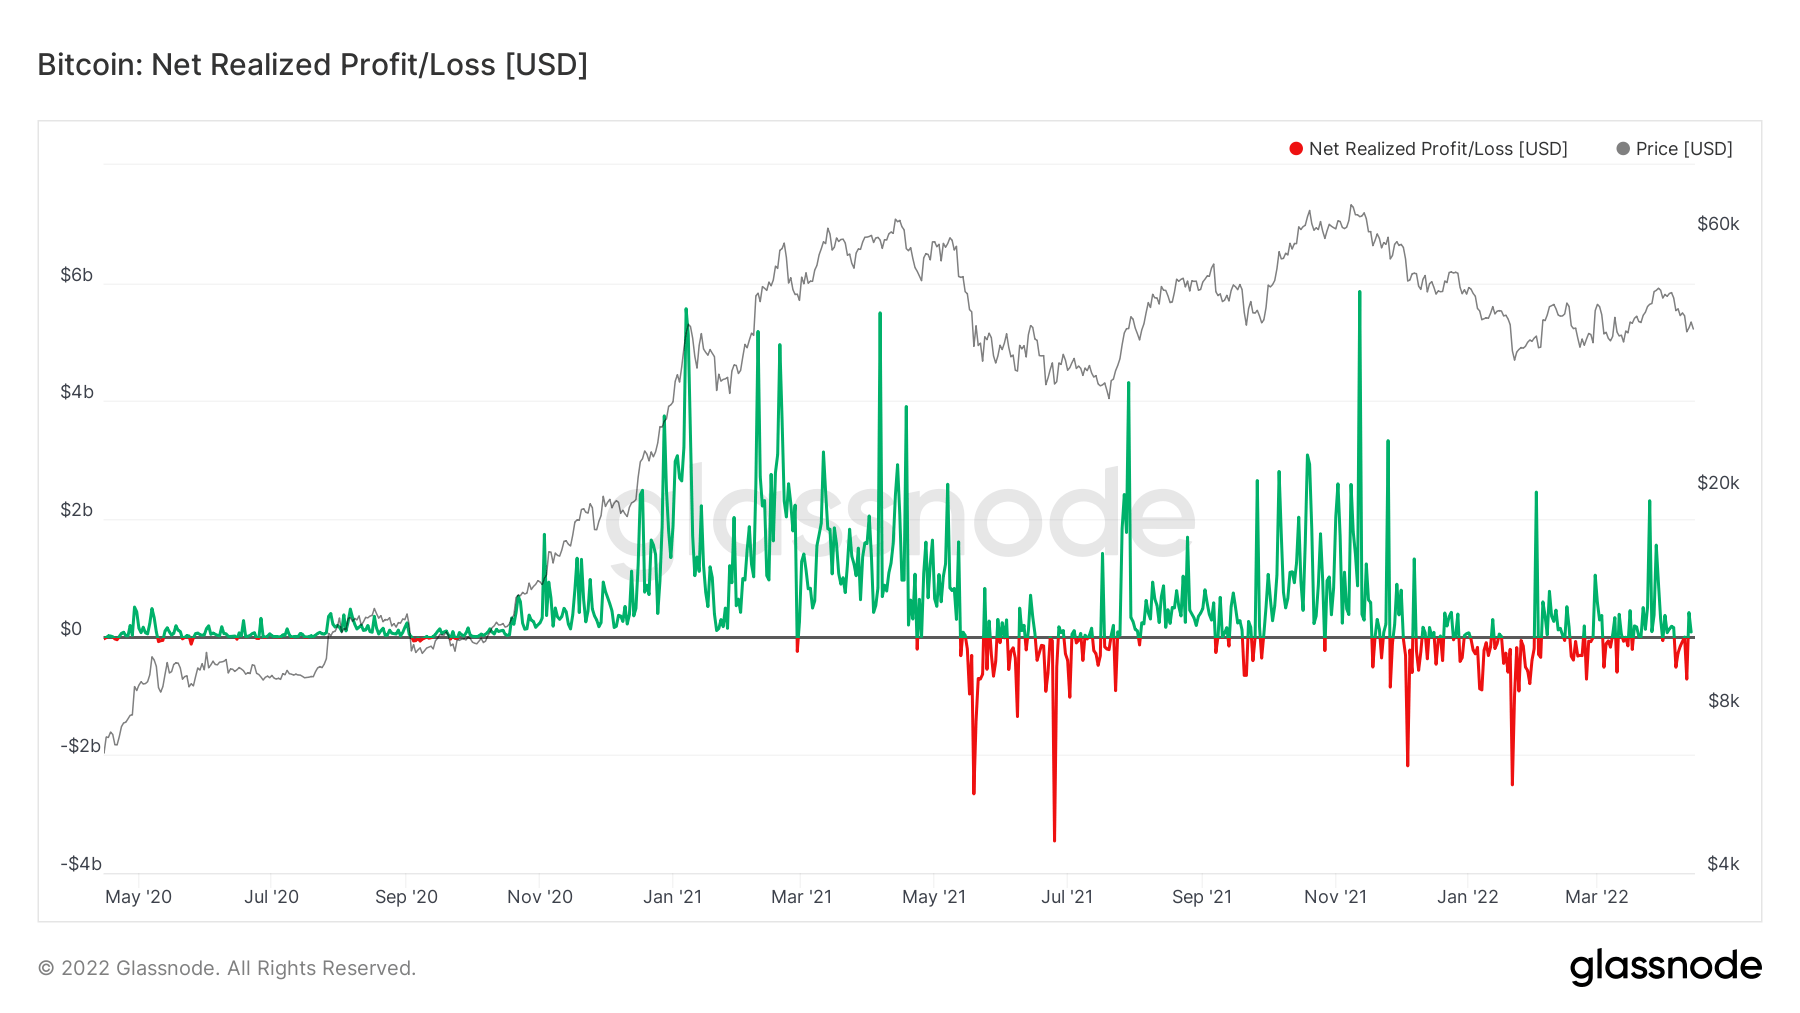
This graph shows the profits and losses made on Bitcoin. We can see that there have recently been some profits taken, especially on this last bullish leg above $45,000.
I also observe that, unlike the drop in May 2021, there is a big move missing that would really scare traders off.
We have not reached the loss levels that we had reached in this period. It is important to have a bearish leg that would bring out the most fragile in order to build a new bullish movement of magnitude.
Summary of key levels.
- $44,500: Confluence horizontal level, volume gap and moving averages. The main area for shoppers to cross.
- $48,000: Lots of volume here, we have already rejected this level.
- $38,000 – $39,000: Daily demand zone, lots of volume: main zone to hold.
Conclusion
It is very difficult to tame the price of Bitcoin in the current economic and geopolitical context. The on-chain data gives us some things that are bullish, but the traditional markets could spoil the party. We will have to be attentive, and stay alert to events: a ceasefire in the Ukraine Russia conflict could be a catalyst for there to be an easing of selling pressure on traditional markets, and by extension, Bitcoin . As I always say: manage your riskand everything will be fine!
Is it possible to be gwinner every time? Whether the Bitcoin price is in great shape, or going through turbulence, Coin Trading offers you to increase your chances of success. Indeed, Trading Du Coin allows individuals to access an algorithmic and 100% automated trading tool. A real trend mechanism, this tool has been designed to adapt to market reversals and position itself on the most dynamic crypto assets of the moment.