The hoped-for preliminary decision on #Bitcoin has been postponed for the time being. So far, the bulls have not succeeded in ringing in the hoped-for end-of-year rally towards the US $ 100,000 mark.
Bitcoin (BTC): Caught between bears and bulls
BTC course: 48,487 USD (previous week: 47,686 USD)
Resistance / goals: $ 48,222, $ 49,942, $ 51,307, $ 53,005, $ 54,077, $ 55,817, $ 56,979, $ 57,901, $ 59,778, $ 61,771, $ 63,189, $ 64,896, $ 66,299, $ 67,416, $ 69,000, $ 70,856, $ 76,472 $ 77,678, $ 85,563, $ 87,090, $ 89,982, $ 100,259, $ 114,961
Supports: $ 46,739, $ 45,553, $ 44,851, $ 42,563, $ 40,585, $ 39,581, $ 37,389, $ 36,643, $ 34,899, $ 30,000, $ 28,810, $ 26,170
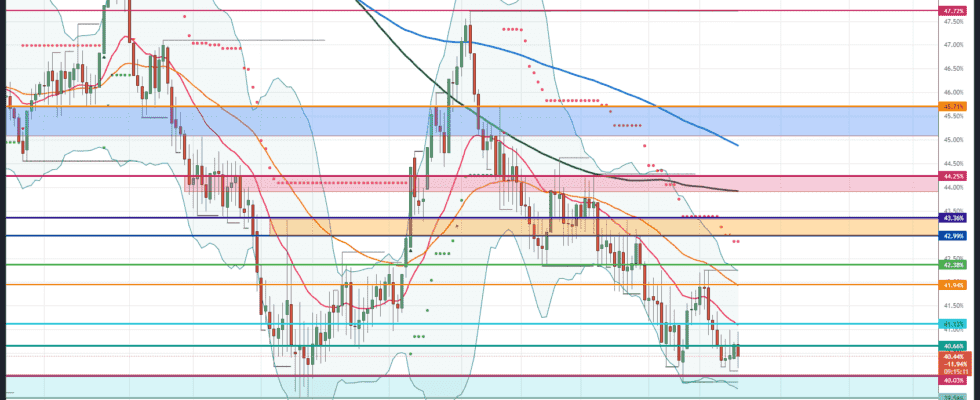
Bitcoin is still not moving. A renewed slide towards the bottom at USD 42,563 was averted several times in the area of USD 45,815, but the push back above the EMA200 (blue) has so far failed. An interesting development can currently be seen in the open interest of Bitcoin futures. Investors bought a large number of short positions in the last few days of trading, betting on an expansion of the price correction for Bitcoin. This development could play into the hands of the bull in the coming trading week. If the BTC rate does not consolidate further south in the near future, the seller side will increasingly close out its short bets again. The background to this is ongoing costs, the so-called “funding rates” for holding such positions. A dissolution of the bearish bets could lead to a so-called “short squeeze” and cause the Bitcoin price to rise significantly.
Bullish scenario (Bitcoin price)
The cops’ resistance is quite remarkable. They have repeatedly been able to avert a break of the weekly low at USD 45,759 and thus stabilize the BTC rate above the MA200 (green). For their part, however, the bulls have to try to lift the Bitcoin rate above the EMA200 at USD 49,942 in order to approach the area at USD 51,307. If the buyer succeeds in breaking the BTC rate above USD 51,307, investors will initially focus on the orange zone again. The EMA50 (orange) and the upper Bollinger band can also be found at USD 53,005. In addition, the supertrend in the daily chart runs along the upper edge of the orange resistance zone at USD 54,077.
If Bitcoin manages to break out of this resistance zone and thus also recapture the red upward trend line, the chart image brightens significantly in favor of the bulls. The subsequent increase should lead Bitcoin immediately to USD 55,817. If Bitcoin also rises back above this resistance level further north, price targets are activated at USD 56,979 and USD 57,901. The Bitcoin price failed several times at this mark at the end of November. If this resistance level is surpassed sustainably, the resist at USD 59,778 will move into the focus of investors. The relevance of this price level has been pointed out again and again in the past few weeks.
The $ 100,000 scenario
If the buyer succeeds in leaving this strong resistance behind in the long term and also overcoming the resistance at USD 61,771, it will be decided in the area between USD 63,189 and USD 64,896 whether Bitcoin will attack its all-time high again. Should Bitcoin then rise above the high of November 15 at USD 66,299, the last hurdles at USD 67,416 and especially USD 69,000 will come into focus. Only a daily closing price above the current all-time high does the rally continue to at least USD 70,856.
If Bitcoin breaks through this price level sustainably, the next target range between USD 76,472 and USD 77,678 is activated. If there is no significant course correction, a subsequent increase in the direction of the target zone between USD 87,090 and USD 89,982 is conceivable. This means that the higher-level price targets of USD 100,259 (361 Fibonacci extension) and USD 114,961 (Fibonacci 461 extension) would be within reach. As long as Bitcoin cannot work its way above USD 60,000, another attack on the all-time high is still a long way off.
Bearish scenario (Bitcoin rate)
The recent increase in the number of bets on a lower Bitcoin rate indicates that many market players are expecting a correction widening of Bitcoin. As long as the bears cap the BTC rate below USD 50,000, an understandable wish. Only when the seller can generate enough selling pressure to push Bitcoin below the weekly low at USD 45,553 per day’s closing price will the chances of a setback towards the low at USD 42,400 increase significantly. Before that, however, the price has to dynamically undercut the support in the USD 44,851 area.
The lower Bollinger Band, which rises significantly to the north, currently runs here. The fact that both Bollinger bands are gradually contracting indicates a preliminary decision in the coming trading weeks. If the bears manage to break through USD 44,851 on a sustained basis, a retest of USD 42,563 is likely. Either the bulls defend this mark and form a double bottom, or the bears break through this support and record another partial success for themselves. Then the September low at USD 40,585 comes into focus as the target.
The horror scenario for bullish investors
Should Bitcoin not turn north here, there will be an important preliminary decision for the following weeks and months at the trailing edge at USD 39,581. The bulls should therefore do everything in their power to defend this price level so as not to finally bury the upward trend. If Bitcoin falls below this price level at the weekly closing price, there is a threat of a trend exacerbation, which will initially lead the BTC price to the 23rd Fibonacci retracement at USD 37,389. If there is no resistance from the buyer here either, Bitcoin will head for the turquoise zone between USD 36,643 and USD 34,899. A direct sale into the purple support zone cannot be ruled out either.
Whether the Bitcoin price can stabilize again in the area of 30,000 USD will largely determine whether the bear winter will continue to expand. A fall back below the striking low of USD 28,795 should provide further panic selling among investors. A sell-off into the light green zone between USD 26,170 and USD 27,562 can then be expected. In this zone the bulls will have to do everything in their power to defend the BTC rate in order to avert the decline in the price towards USD 20,000.
Bitcoin dominance cannot break away from the year’s low
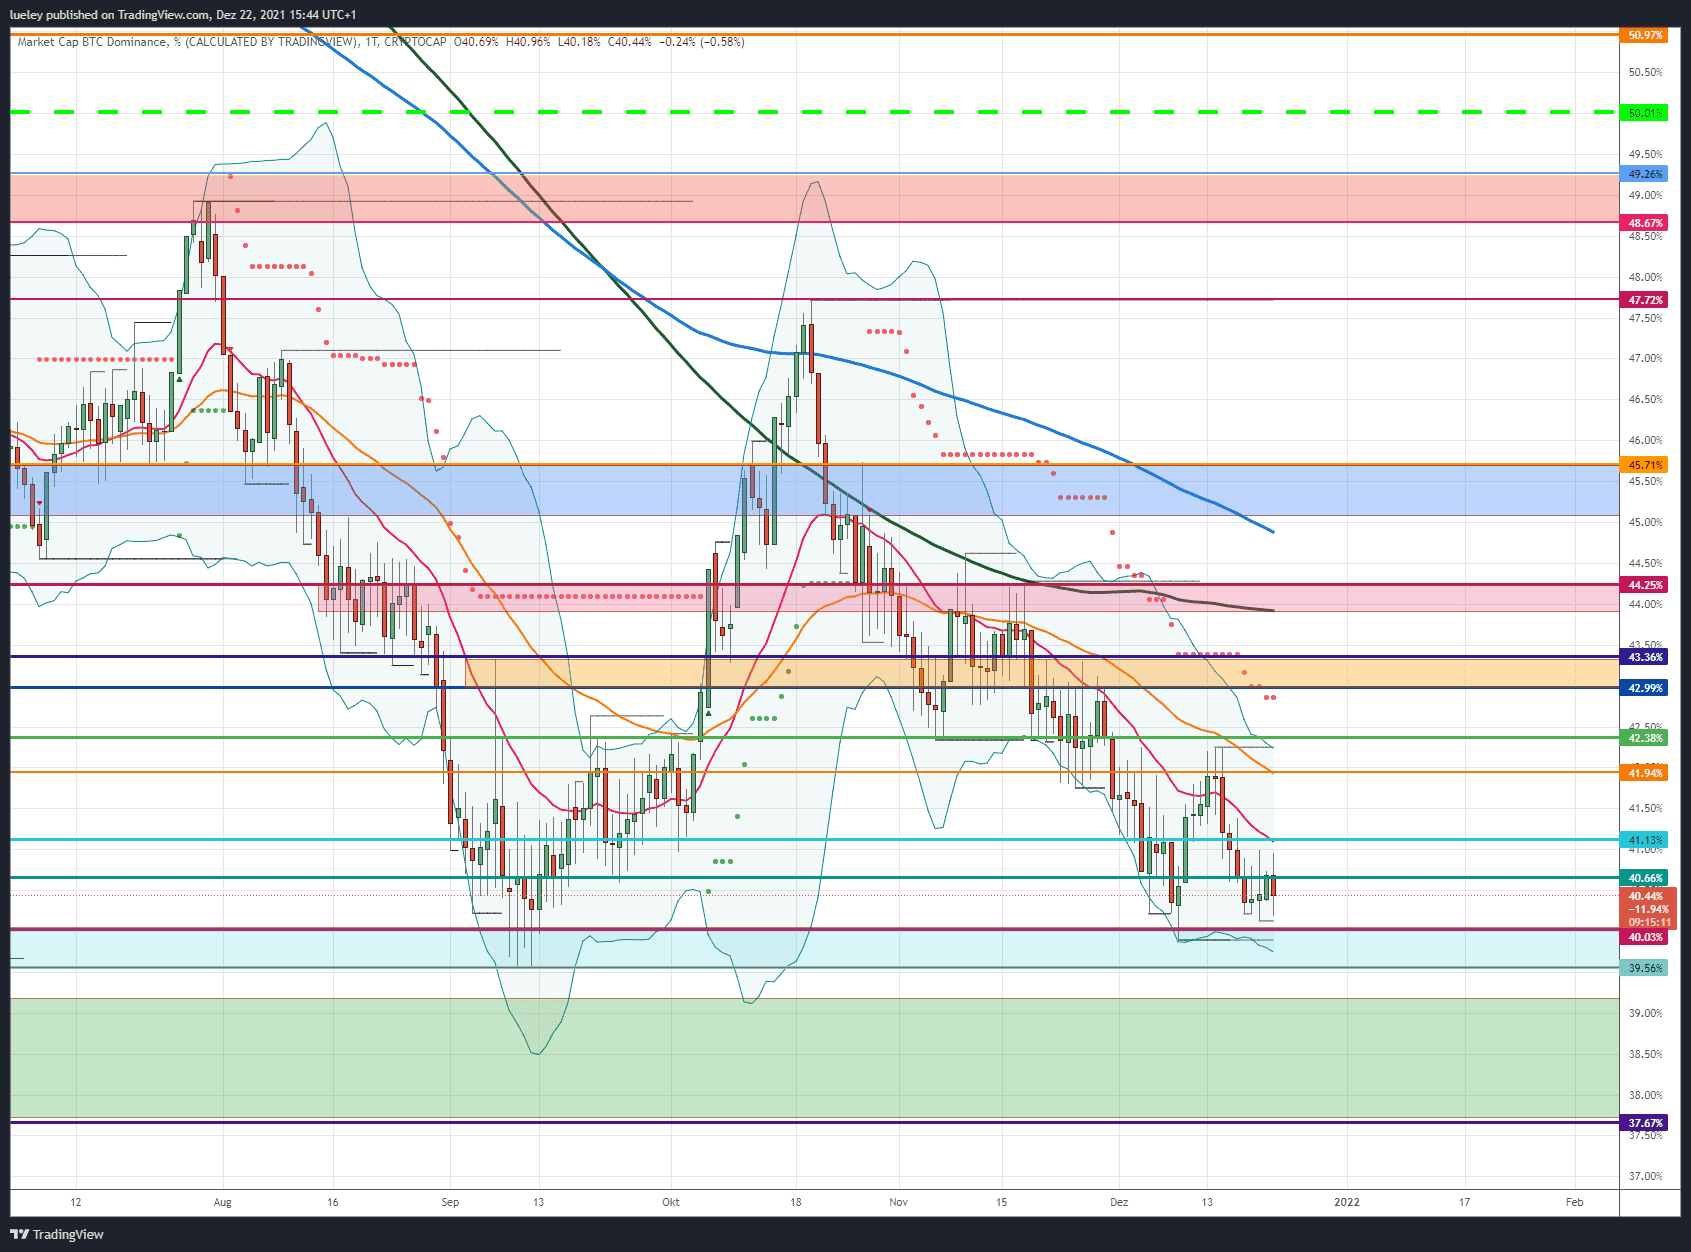
One could think that the Bitcoin dominance simply does not want to increase sustainably. A possible turnaround has to be postponed again. The increase attempt in the previous week was stalled again and the market power of the crypto reserve currency slipped back towards 40 percent as a result. Currently, the BTC dominance is again wedged between 41.13 percent and 40.03 percent. Furthermore, it is necessary to wait for the resistance at 41.94 percent to be regained before new impulses can be expected.
BTC Dominance: Bullish Scenario
The BTC dominance continues to move impulsively in the area of the 40 percent mark. A first attempt to increase should lead the BTC dominance to 41.13 percent. The EMA20 (red) and a horizontal resistor are already waiting here. Only when this mark is exceeded by the daily closing price does the important mark of 41.94 percent come into focus again. The EMA50 (orange) is currently also running here. Only when this resistance is broken through sustainably and the 42.38 percent are recaptured will the orange zone between 42.99 percent and 43.36 percent be activated as the next target area.
Just below it is the super trend in the daily chart, another strong hurdle. A price setback is therefore very likely. If the Bitcoin dominance can overcome this zone in the medium term, the recovery movement will expand into the red resist zone. The MA200 (green) can currently be found here. This area could not be overcome several times recently. From the current point of view, this area represents the maximum price target on the upside for the coming weeks. More than 44.25 percent is therefore not expected for the time being.
BTC Dominance: Bearish Scenario
The BTC dominance is still not moving. As was always the case last time, any attempt to rise is immediately negated. The proximity to the annual low could lead to a new low this year if the 40.03 percent break and a subsequent retest of 39.56 percent occur. The more frequently a support is started, the more pronounced the downward movement should be if the support breaks.
If there is no dynamic countermovement at this mark back above the 40 percent threshold, the Bitcoin dominance could correct up to the psychologically important 30 percent mark in the medium term. As long as the 40 percent is not given up, however, impulses towards the north can be expected at any time.
Disclaimer: The price estimates presented on this page do not constitute buy or sell recommendations. They are only an assessment of the analyst.
The chart images were created using TradingView created.
USD / EUR exchange rate at the time of going to press: 0.88 euros.