After a positive price development over the holidays, Bitcoin (BTC) has to cope with another significant price decline shortly before the end of the year.
Bitcoin (BTC): back in range after a failed breakout attempt
BTC course: 46,885 USD (previous week: 48,487 USD)
Resistance / goals: $ 48,222, $ 49,942, $ 51,307, $ 52,125, $ 53,005, $ 54,077, $ 55,817, $ 56,979, $ 57,901, $ 59,778, $ 61,771, $ 63,189, $ 64,896, $ 66,299, $ 67,416, $ 69,000, $ 70,856 $ 76,472, $ 77,678, $ 85,563, $ 87,090, $ 89,982, $ 100,259, $ 114,961
Supports: $ 46,739, $ 45,474, $ 44,851, $ 42,542, $ 40,585, $ 39,581, $ 37,389, $ 36,643, $ 34,899, $ 30,000, $ 28,810, $ 26,170
Also this week the Bitcoin bulls tried to heave the BTC rate back northwards above the 52,000 USD. However, the temporary price rally over the Christmas holidays has so far not been enough for a sustainable breakout. Instead, the bears impressively countered this attempt to break out of the sideways range between USD 45,500 and USD 52,000. The key crypto currency is currently threatening to enter the support zone between USD 45,474 and USD 44,851 again. Should the purple upward trend line be abandoned at the daily closing price, a retest of the low at 42,542 USD is even conceivable. It is imperative that the buyers take action here so as not to jeopardize the upward trend in the long term.
Bullish scenario (Bitcoin price)
Although the bulls have so far been able to prevent a sustained price slide back below USD 45,474, they have so far lacked the strength to attempt a dynamic breakout. As long as the BTC rate does not drop below USD 44,851 at the daily closing rate, there is still a chance for further attempts to rise. For this, Bitcoin has to rise back above the cross resistance from MA200 (green) and horizontal resist at 48,222 USD. Another strong hurdle awaits at USD 49,942 with the EMA200 (blue) and the EMA20 (red). Should the buyer succeed in breaking this psychologically important price mark, the USD 51,307 mark will come back into focus. On several occasions, this resistance could not be regained by the daily closing price.
Only when the buyer succeeds in breaking the BTC rate above USD 51,307 and subsequently jumping over the weekly high of USD 52,125 would the immediate risk of a bearish sell-off be averted. A price rise above this resistance from the EMA50 (orange) and the upper Bollinger Band requires a significant push from the bulls. If the BTC rate can break this mark at the end of the day, an increase into the orange resist zone between USD 53,005 and USD 54,077 must be planned. The supertrend in the daily chart is currently also running here. If the buyer side then builds up enough buying pressure to regain this resistance zone at the daily closing price, the chart briefly brightens in favor of the bulls. As a result, Bitcoin could immediately soar to $ 55,817.
The bulls are expected to return
If the Bitcoin price can also break this resistance level and thus regain the red overarching upward trend line, price targets at USD 56,979 and USD 57,901 are activated. As early as November, the BTC rate was unable to overcome this area several times. If, contrary to expectations, there is a breakout above these resistance levels, a medium-term directional decision can be expected at USD 59,778. The relevance of this course level was already discussed several times in the last analyzes. A breakout above this resistance would have a signal effect and should cause Bitcoin to rise further north. Then Bitcoin could penetrate again into the area between USD 63,189 and USD 64,896 if it breaks above USD 61,771.
If Bitcoin does not rebound significantly to the south and can also leave the high of November 15 at USD 66,299 behind, USD 67,416 and the all-time high of USD 69,000 should also be tested again. If Bitcoin can subsequently develop a new all-time high and also break through USD 70,856, an increase towards USD 76,472 and USD 77,678 is likely. For the time being, this zone is to be seen as the maximum price target on the upside. It remains to be seen whether and when Bitcoin can develop the dynamic increase in the direction of the much-cited USD 100,000. A counterattack from the seller can be expected at any time below USD 60,000.
Bearish scenario (Bitcoin rate)
For the time being, the bears are still on the trigger. This week, too, the bullish attempt to rise could be clearly negated. For its part, the seller side must now do everything in its power to dynamically push the Bitcoin rate below USD 46,739 in the direction of the low at USD 45,474. Should Bitcoin drop below this support level and break the bulls’ last lifeline in the form of the lower Bollinger Band at USD 44,851, a directional decision will be made at the low of USD 42,542. If the bulls give up this price mark at the end of the day, the September low at USD 40,585 becomes the target mark. This would put the BTC rate again threateningly close to the trailing edge at USD 39,581.
A break in this important support level would end the uptrend for the time being. A weekly closing price below this support level leads to a clear sharpening of the trend. The BTC rate should immediately fall back to the 23rd Fibonacci retracement at USD 37,389. A direct sale up to the turquoise zone between USD 36,643 and USD 34,899 should not come as a surprise either. If the bulls don’t come back into the market here, a renewed test of the USD 30,000 is almost inevitable. If this psychologically important mark is undercut, a retest of the USD 28,795 should be planned. A technical countermovement can be expected here in the short term, but a sell-off to the light green zone between USD 26,170 and USD 27,562 should not come as a surprise. A relapse to close to $ 20,000 can only be averted by massive purchases by the bulls.
Bitcoin Dominance: Same Procedure as every Week
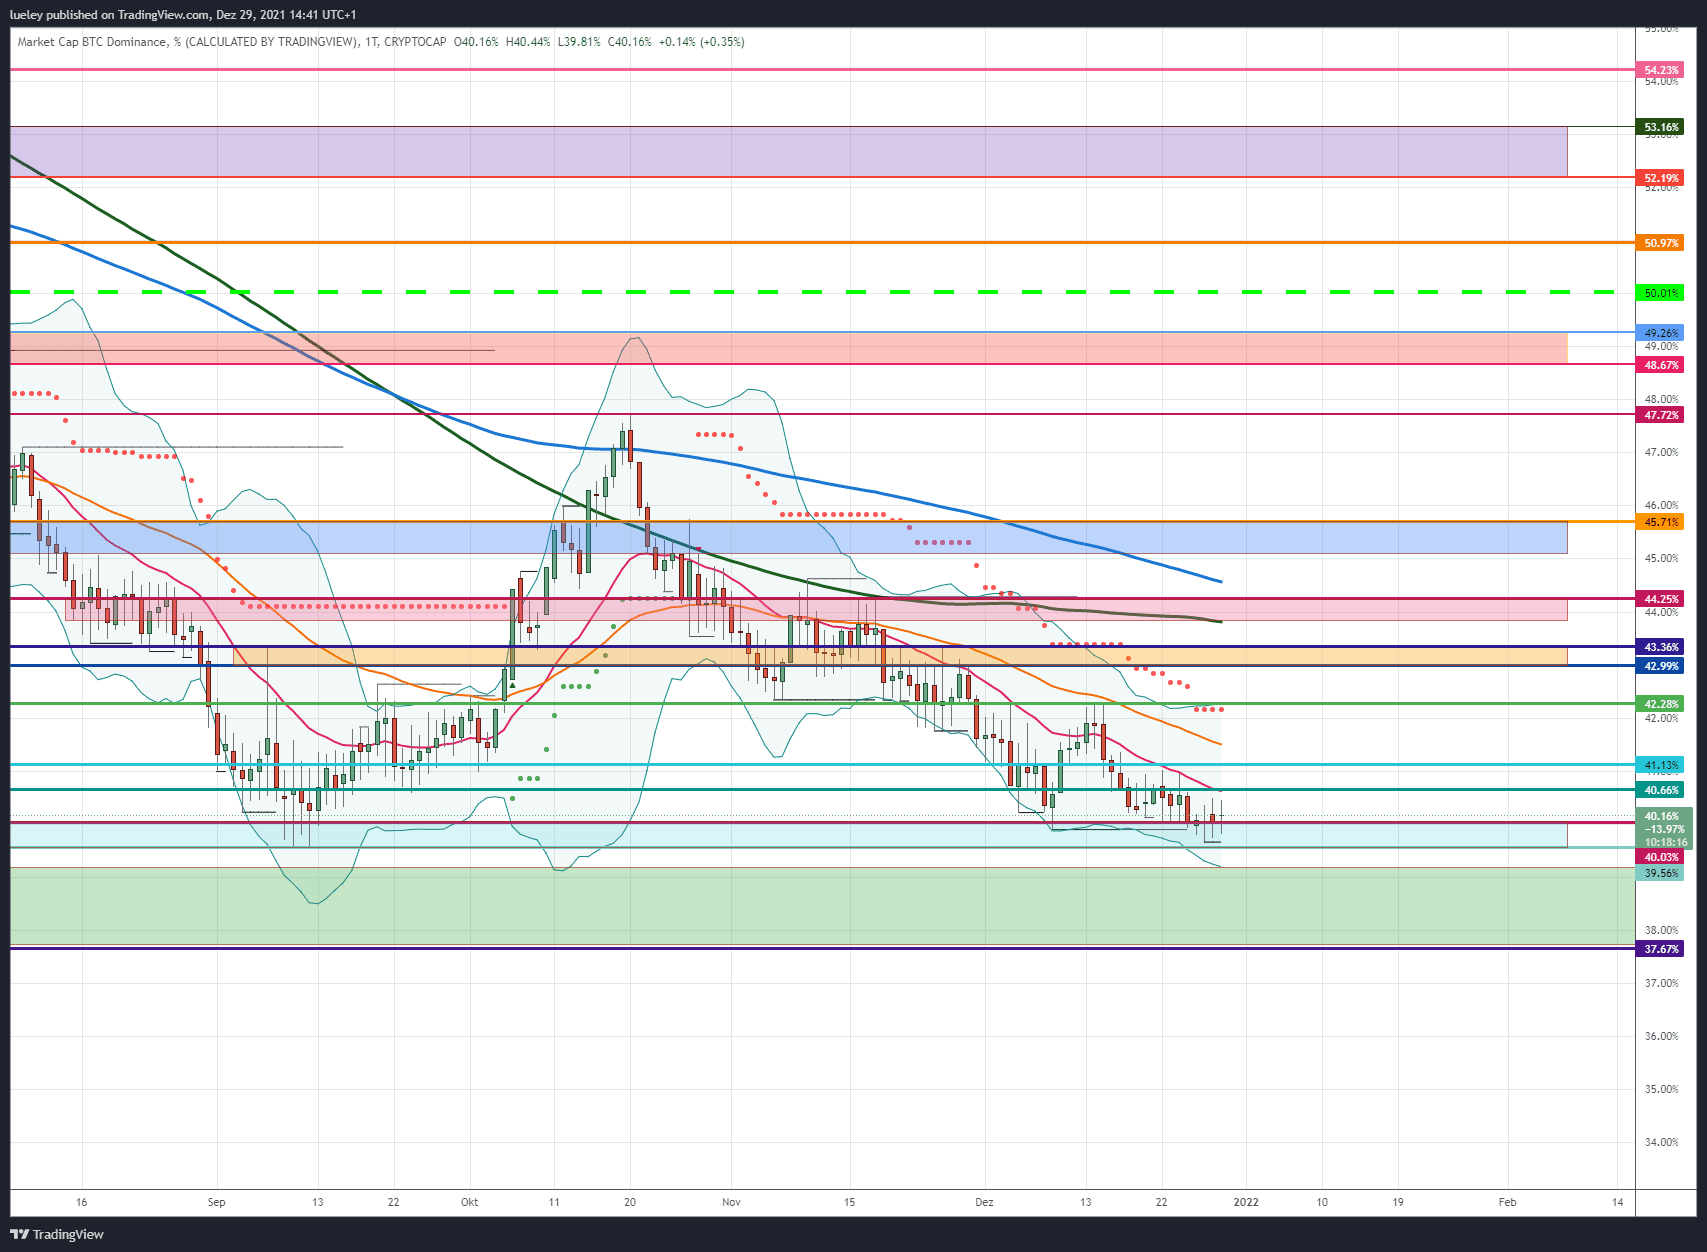
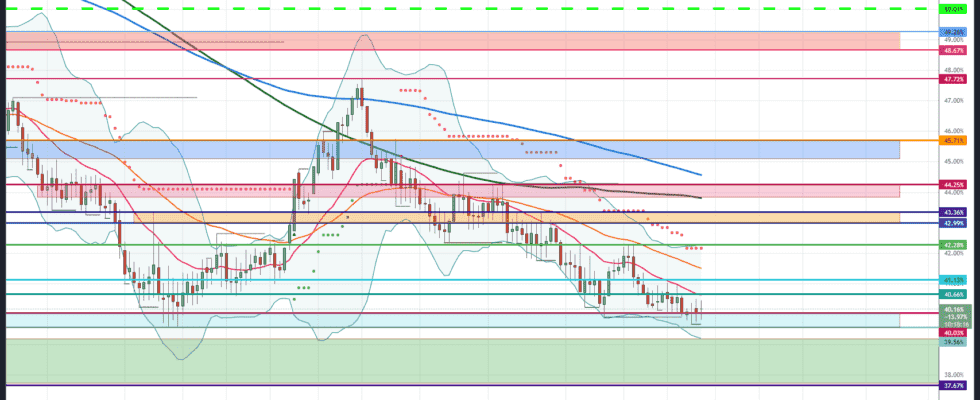
Bitcoin dominance continues to hover around its annual lows. Although it has so far been possible to prevent a bearish follow-up movement below 39.56 percent, a sustained rise back above the EMA20 (red) failed again this week. Before the resistance at 42.38 percent is not sustainably recaptured, the downside risks predominate.
BTC Dominance: Bullish Scenario
The BTC dominance can still not break away from the 40 percent mark. The first cross resistance from EMA20 and horizontal resistance line is already waiting at 40.66 percent. Should this resist be overcome, an increase of up to 41.13 percent is initially conceivable. If this mark can also be regained at the daily closing price and subsequently the EMA50 (orange) can also be broken, the area of 42.28 percent moves into focus as the target mark. In addition to the horizontal resistance, the supertrend and the upper Bollinger band can also be found in this zone.
In the first attempt, the Bitcoin dominance should ricochet off towards the south. Only when this zone can be skipped sustainably is a subsequent increase to the orange resistance zone between 42.99 percent and 43.36 percent conceivable. If this area is also overcome in the medium term, the recovery movement will expand in the direction of the red resistance zone. The MA200 (green) is currently at 43.82 percent. The ongoing weakness makes a march back over the upper edge of this resist area currently unlikely, the dominance of the crypto reserve currency has been too weak in recent weeks. The maximum medium-term target price on the upside remains unchanged at 44.25 percent.
BTC Dominance: Bearish Scenario
The longer the BTC dominance cannot break away from its history lows to the north, the more likely it will slide below the annual low of 39.56 percent. If you look at the prices of many Altcoins, there has already been a relative strength compared to the crypto key currency Bitcoin in the last few days and weeks. This is reflected in the poor performance of the BTC dominance. As has been the case again and again recently, every attempt to climb is currently being pushed south again by the bears.
Should the BTC dominance fall below 39.56 percent at the daily closing price, the trend movement will immediately expand to 37.67 percent. This is the last chance for a countermovement to the north. However, if there is no dynamic countermovement in this area, a correction expansion of the Bitcoin dominance up to the psychologically important 30 percent mark can no longer be ruled out in the medium term. Such a correction of the market power of Bitcoin should lead to an increased independence of the Altcoins, which would be positive for the entire crypto market.
Disclaimer: The price estimates presented on this page do not constitute buy or sell recommendations. They are only an assessment of the analyst.
The chart images were created using TradingView created.
USD / EUR exchange rate at the time of going to press: 0.88 euros.