
Ah the leverage …
Total Closeouts Market Futures
Source: Coinglass
Wednesday January 5th was another dark day for leveraged trading. Over $ 600 million was liquidated yesterday, one of the biggest liquidations in recent months. Moreover, we note that over the last few weeks, the liquidations have had a direct impact on the price of cryptocurrencies because the little volume, not to say nonexistent, on the traditional market does not make it possible to compensate for these chain reactions of sale on futures exchange platforms.
If the leverage effect makes some traders dream of rapid gains and the life of a pasha, it is through this technique that trading platforms earn a large part of their income. So don’t count on them to distract you from this ruthless trading mode for the uninitiated. Now that we understand that the bloodshed has taken place in the futures market, what about the traditional market?
Observation and wait-and-see policy
Taking an interest in the psychology and behavior of investors in the short and long term is essential to fully understand the price fluctuation of a digital asset. The graph below highlights the proportion of the supply of older coins (1 year – 2 years, blue curve) to compare it to the supply of younger coins (1 week – 1 month, green curve). There are some interesting trends.
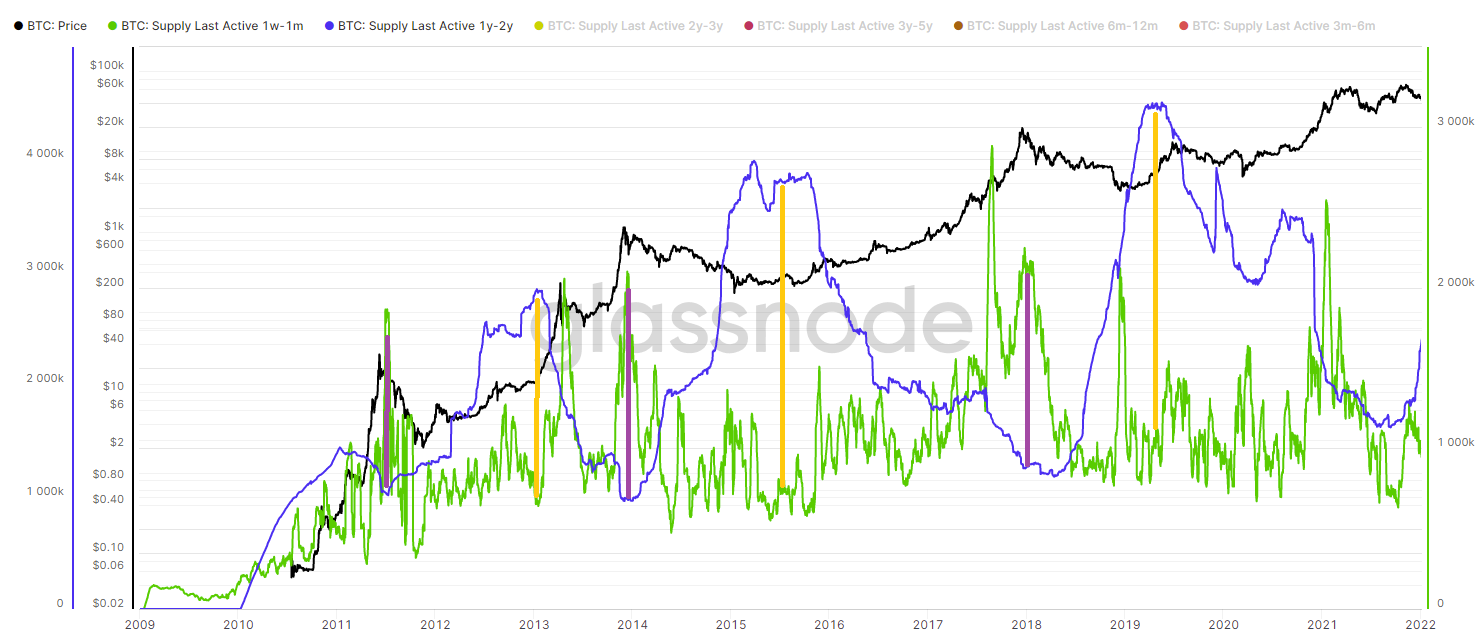
Comparison of the offer of old coins (1-2 years) and the offer of
young coins (1 week – 1 month) / Bitcoin price
Sources: Glassnode
In bull markets (purple vertical bar): the supply of young coins is higher than the supply of old coins. In other words, new young speculators are entering the market while old ones sell their old coins during this bullish euphoria.
In bear markets (yellow vertical bar): the supply of young coins is lower than the old coins. In other words, older hands are accumulating supply much more strongly than younger hands.
This is evident from this graph. The old coins (blue curve) represent an increasingly important part of the total supply of coins in circulation at the time of this writing. The opposite is true for young pieces. We observe a well-known behavior of traditional finance that applies to the world of cryptocurrencies. Smart money accumulates supply during down periods as young speculators buy all-time highs. Bitcoin’s on-chain data makes it possible to directly observe these behaviors by highlighting, to a certain extent, the psychology of investors.
You are probably thinking to yourself that it is enough simply to follow the movements of the old hands by replicating their operations. However, the demons of greed and FOMO (Fear Of Missing Out) shake investors when the markets take off. Dealing with emotions in a market as volatile as digital assets is proving to be a real duel with yourself. Let’s go a little further in understanding this aging of parts. Place the graph and we then comment:
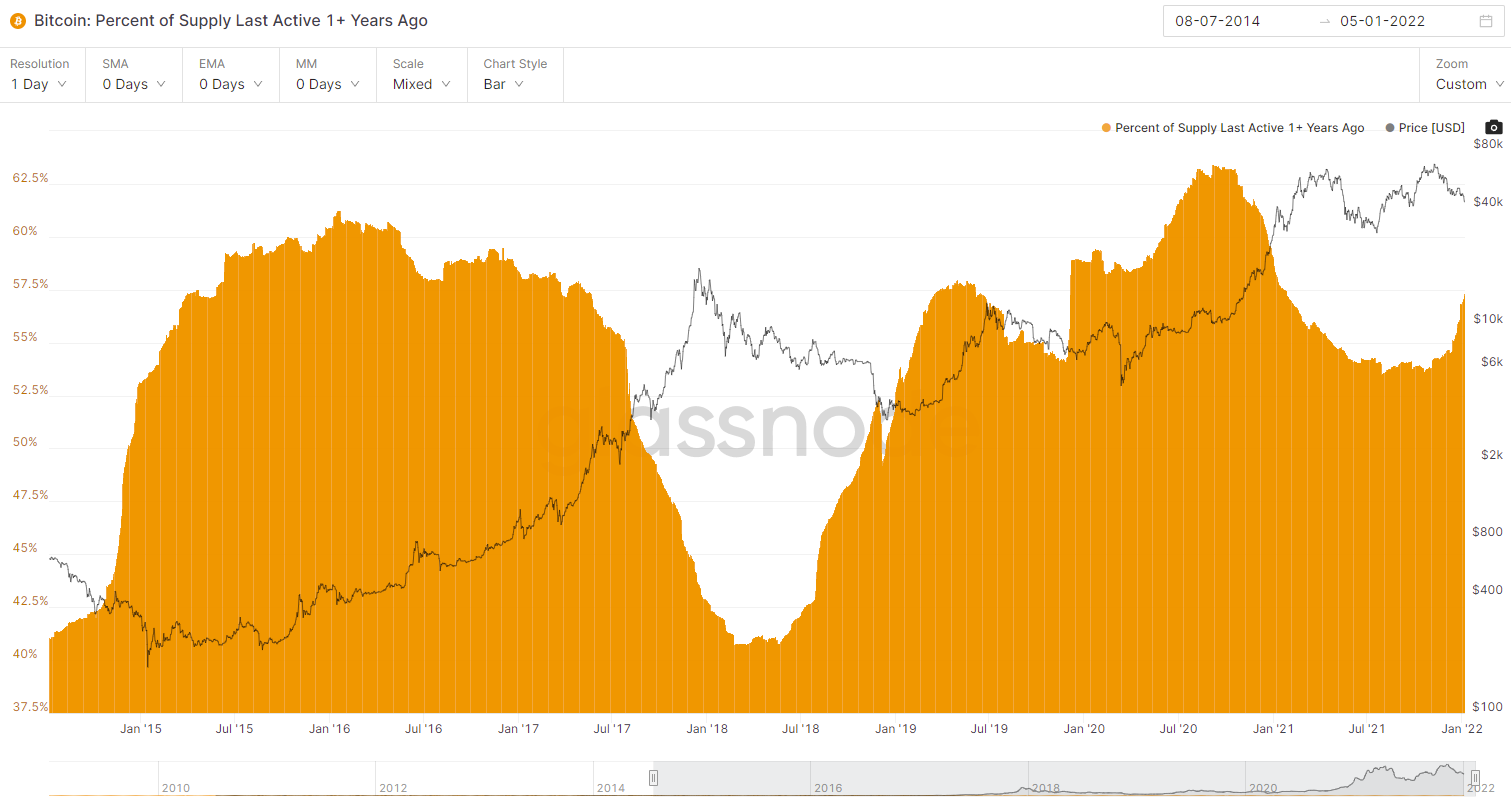
Bitcoin: Percent of Supply Last Active 1+ Years Ago
Source: Glassnode
This graph shows the percentage of coins older than 1 year. In other words, of all the coins currently in circulation, 67% of them were purchased more than a year ago. A percentage that has increased in recent days, thus proving an increased conservation of parts. We can interpret this coin retention as the confidence of old hands for the current price of bitcoin.
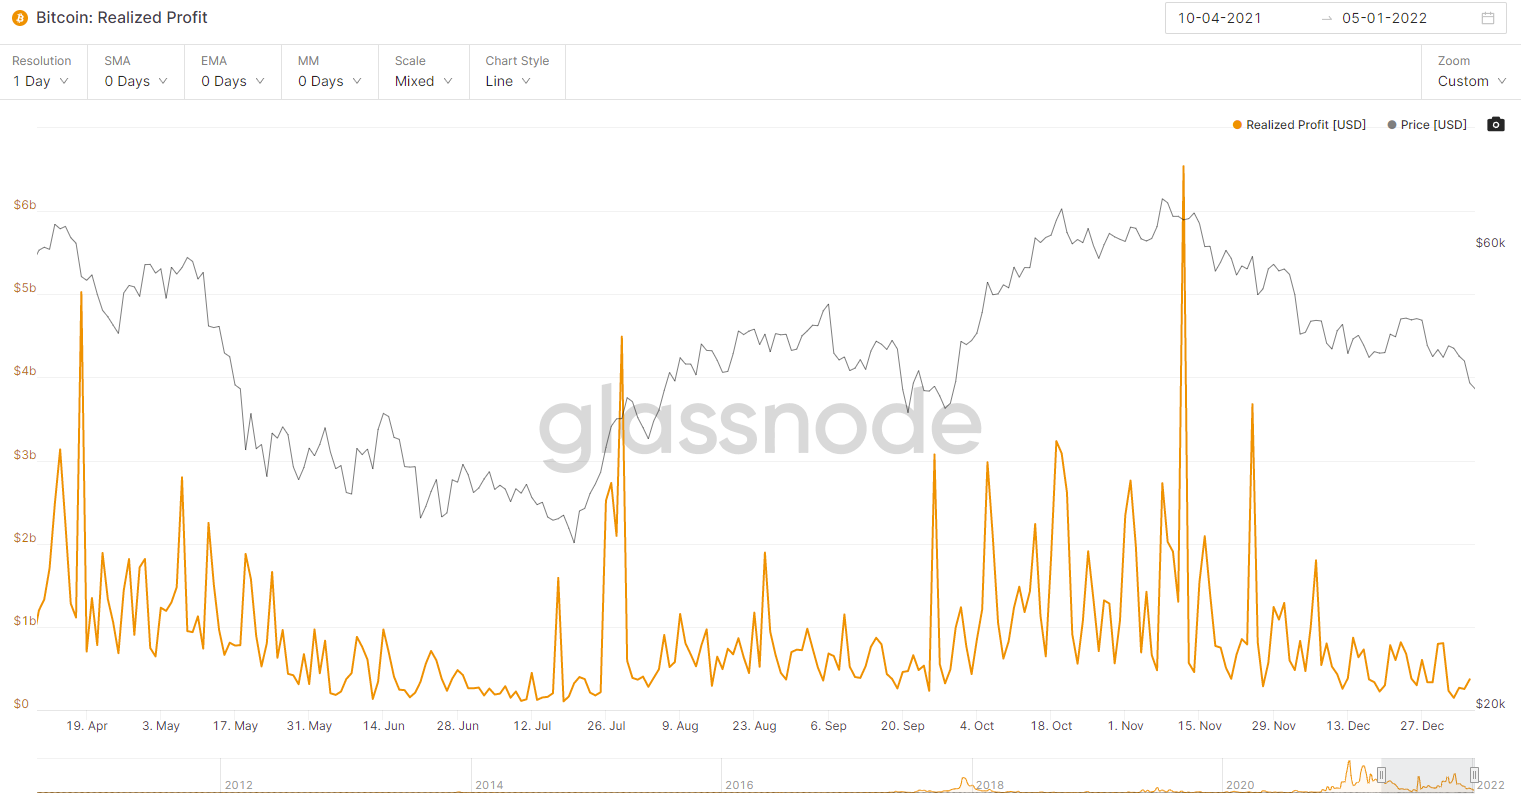
Bitcoin: Realized Profit
Source: Glassnode
The graph above shows the number of coins sold at profit. A number is at extremely low levels compared to historical data. In other words, very few investors resell their coins which were bought at a lower price than the current price. What about parts sold at a loss?
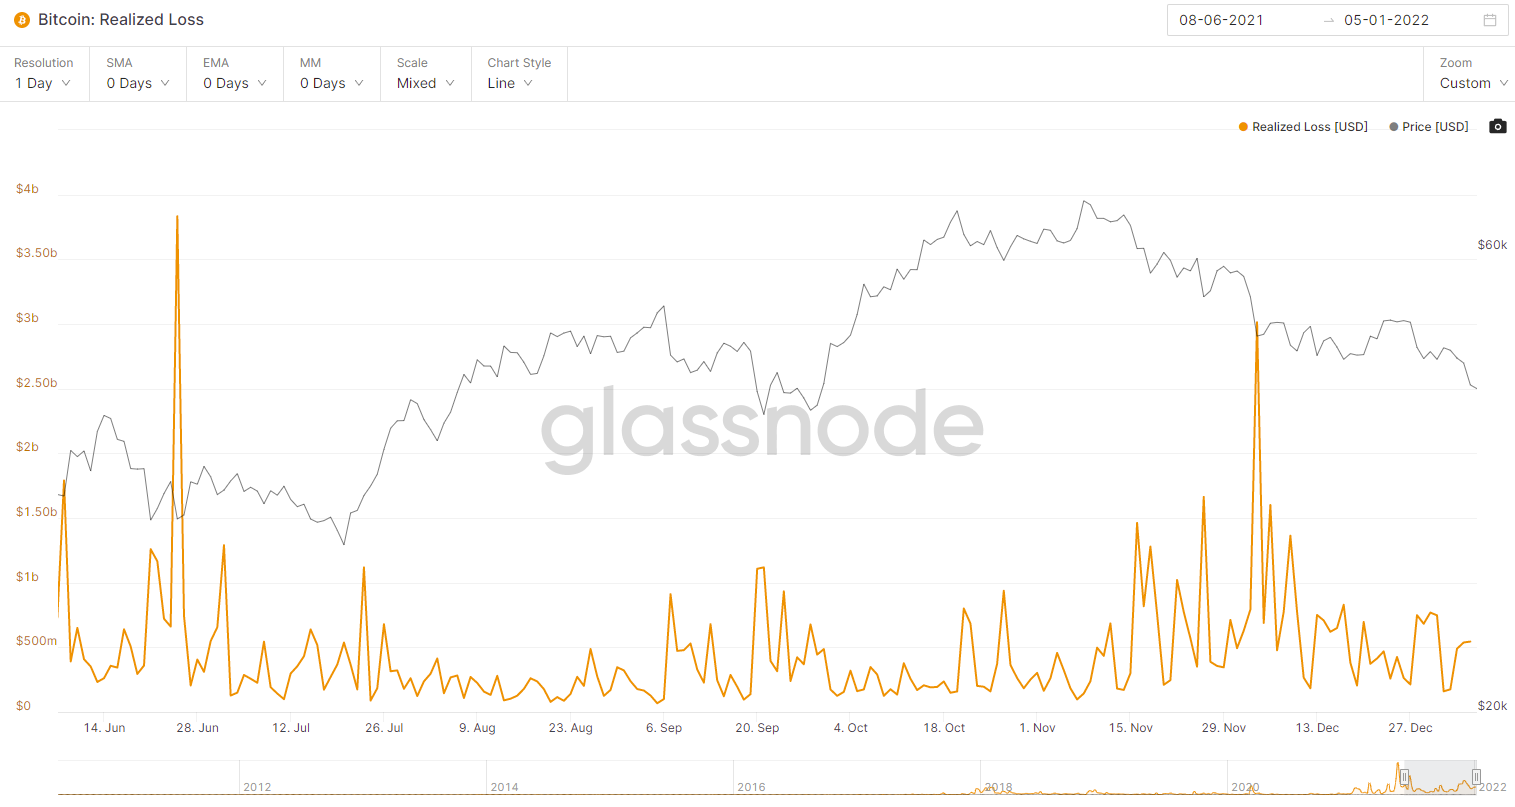
Bitcoin: Realized Loss
Source: Glassnode
The number of coins sold at a loss, although higher than the number of coins sold at a profit, is also at very low levels compared to recent weeks. In other words, the coins that are being sold on the network now are mostly coins bought at a higher price than the current price. It is understandable that investors who have taken positions on historic highs of $ 69,000 are starting to get nervous after a decline that tends towards -40% from these highs.
What can we infer from the recent drop? On the one hand, leveraged traders are punished by falling prices, which leads to downward chain reactions through the effect of position liquidations. This situation may persist in the short term. On the other hand, the coins put back into circulation are mainly coins sold at a loss by players who have taken positions at a higher price. The debate rages on the subject of “bear market or not?“In other words, are we entering a bearish cycle? I am monitoring the evolution of tokens like milk on the fire in order to soon publish a new inventory of the network in the columns of Zonebourse.