
Bitcoin (BTC) is trading above a crucial Fibonacci support area and has generated several bullish signs.
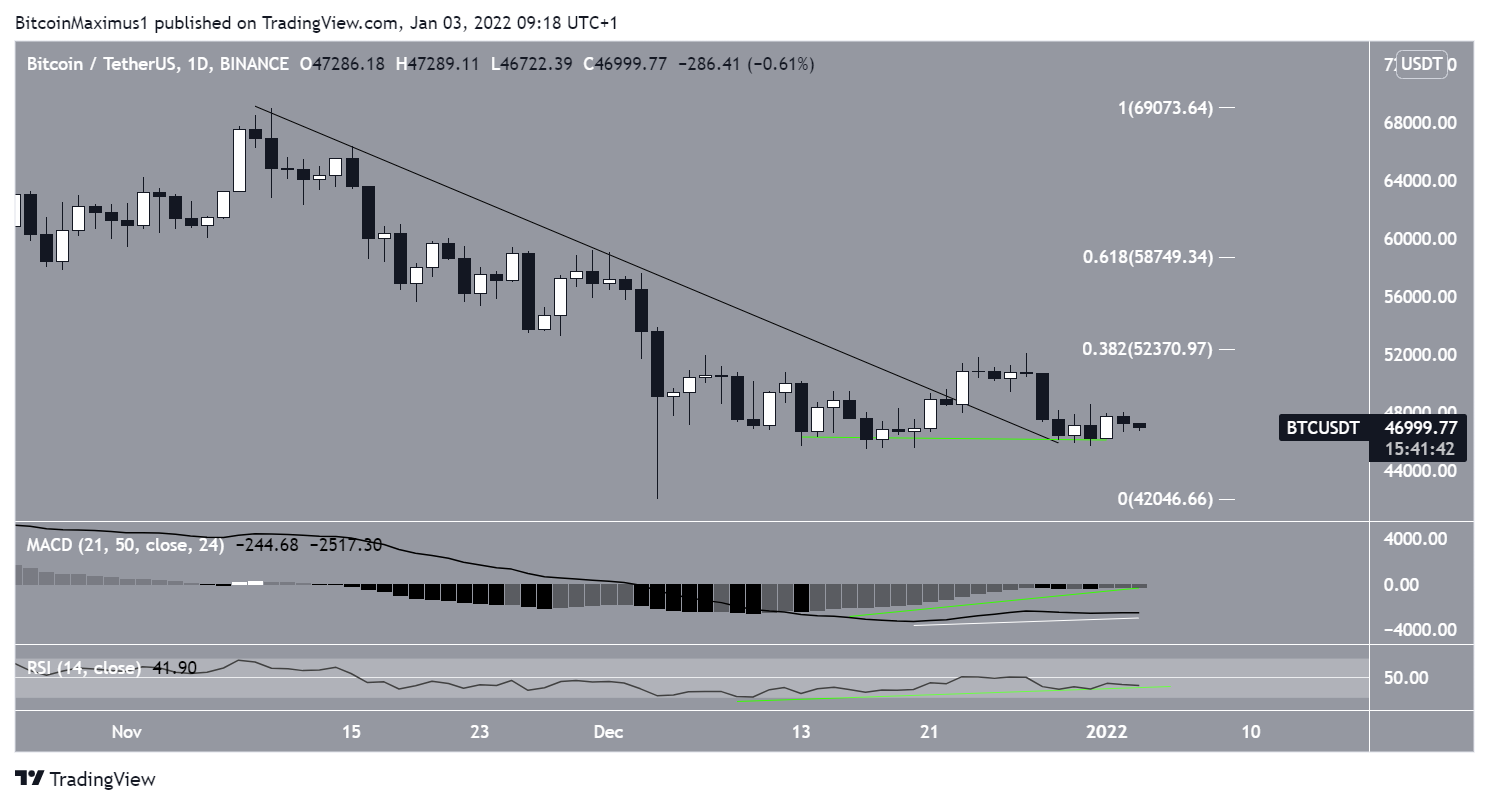
The price of BTC declined significantly during the week of December 27 to January 2, dropping in the process to a low of $ 45,678. That said, it then rebounded and managed to close at $ 47,286. This development is crucial, knowing that thus, the previous Japanese candlestick of recovery was not canceled.
BTC is currently trading just above the support of the 0.618 Fibonacci retracement, located at $ 44,300.
That said, technical indicators paint a neutral outlook.
The RSI, which is a momentum indicator, sits right at the 50 line (red circle). This is the sign of a neutral trend. A decisive move above or below this line is needed to clarify the direction of the trend.
Likewise, the MACD, which is created by short and long term moving averages (MA), is falling but remains positive.
Bullish divergences
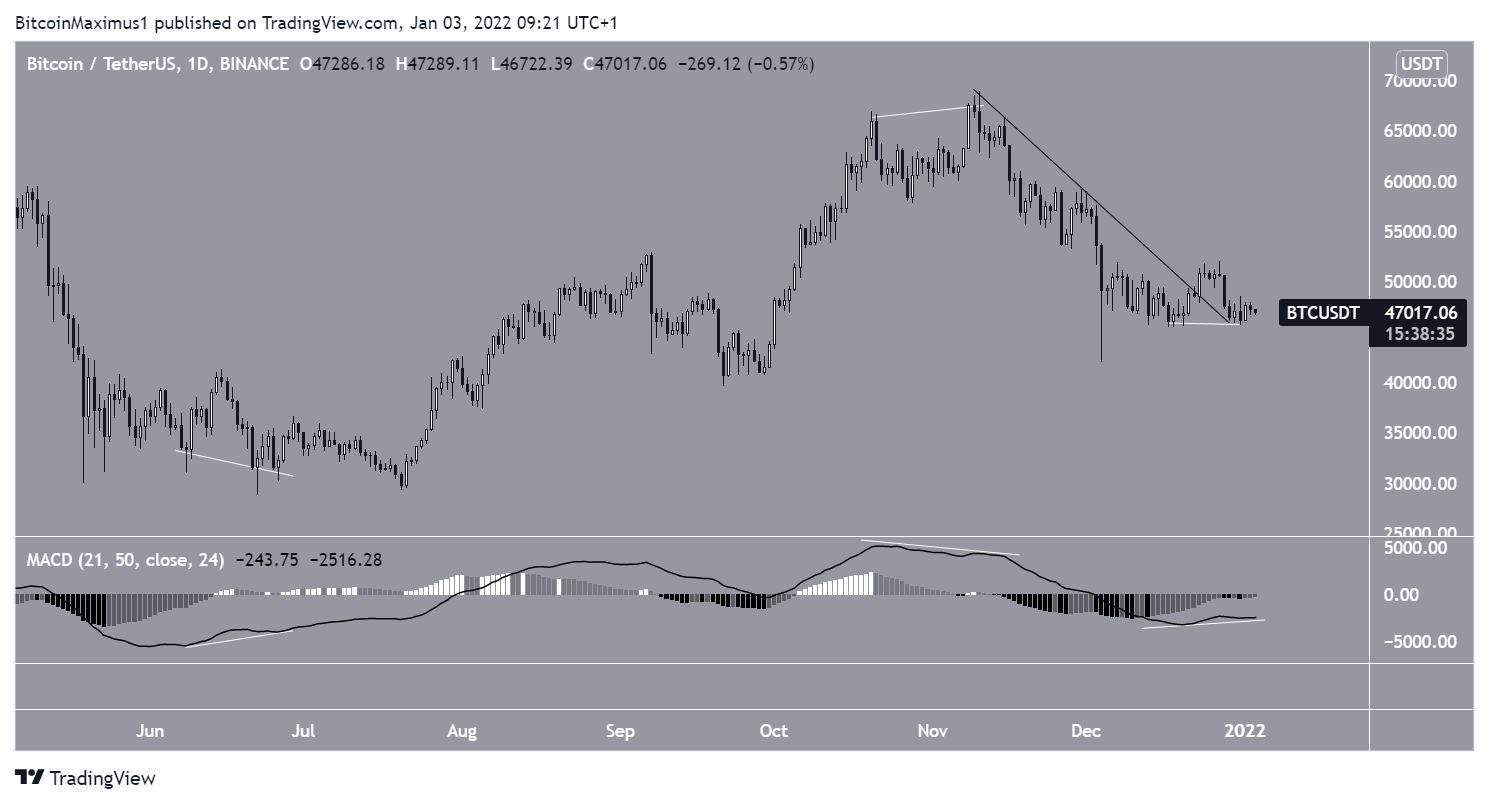
The daily BTC chart shows a much more bullish outlook. This is mainly due to the multiple bullish divergences present in both the RSI and MACD.
The main resistance area is at $ 52,400, but there is also a larger resistance level at $ 58,750. This is both a horizontal resistance area and resistance of the 0.618 Fibonaccci retracement.
When it comes to indicator readings, the divergence from the MACD line is particularly crucial. The last two times this has happened, a big move in BTC has followed.
Compared to the current reading, the previous divergences were more pronounced. Thus, it is possible that Bitcoin will continue to develop this divergence before initiating a significant upward movement.
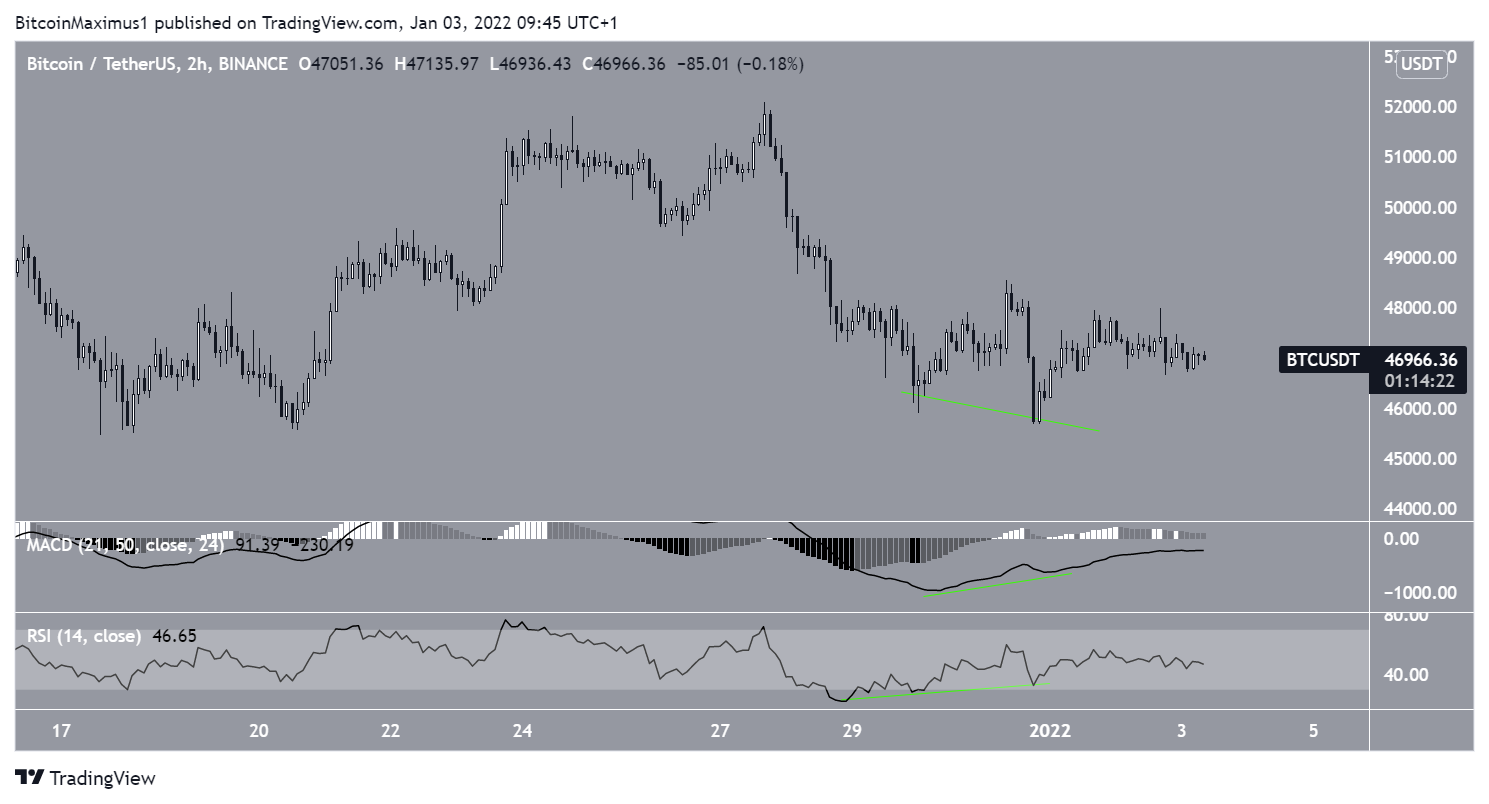
Short-term movement of Bitcoin
As on the daily chart, the two hour chart shows bullish divergences within the MACD and RSI. This means that an upward movement towards the previously mentioned resistance levels is likely.
Disclaimer
All information on our website is published in good faith and for general information purposes only. Any action taken by the reader based on the information found on our website is entirely at their own risk.