
After going under a short-term trading pattern, Bitcoin (BTC) rebounded to the $ 48,000 support area.
BTC has been declining from its local high of $ 52,088 on December 27 (red arrow). The decline movement continued to a low of $ 45,900, reached on December 30.
This decline in Bitcoin initially seemed to push it under the figure of an ascending parallel channel within which it traded. That said, he then returned to that channel’s support line. So, knowing that the lines of the channel are not maintained, it is likely that the price of BTC follows a different pattern.
The price rebound validated the $ 45,800 area as support. This is the primary support for Bitcoin, made up of a horizontal support as well as the 0.618 Fibonacci retracement.
The main resistance area is found at $ 51,500.
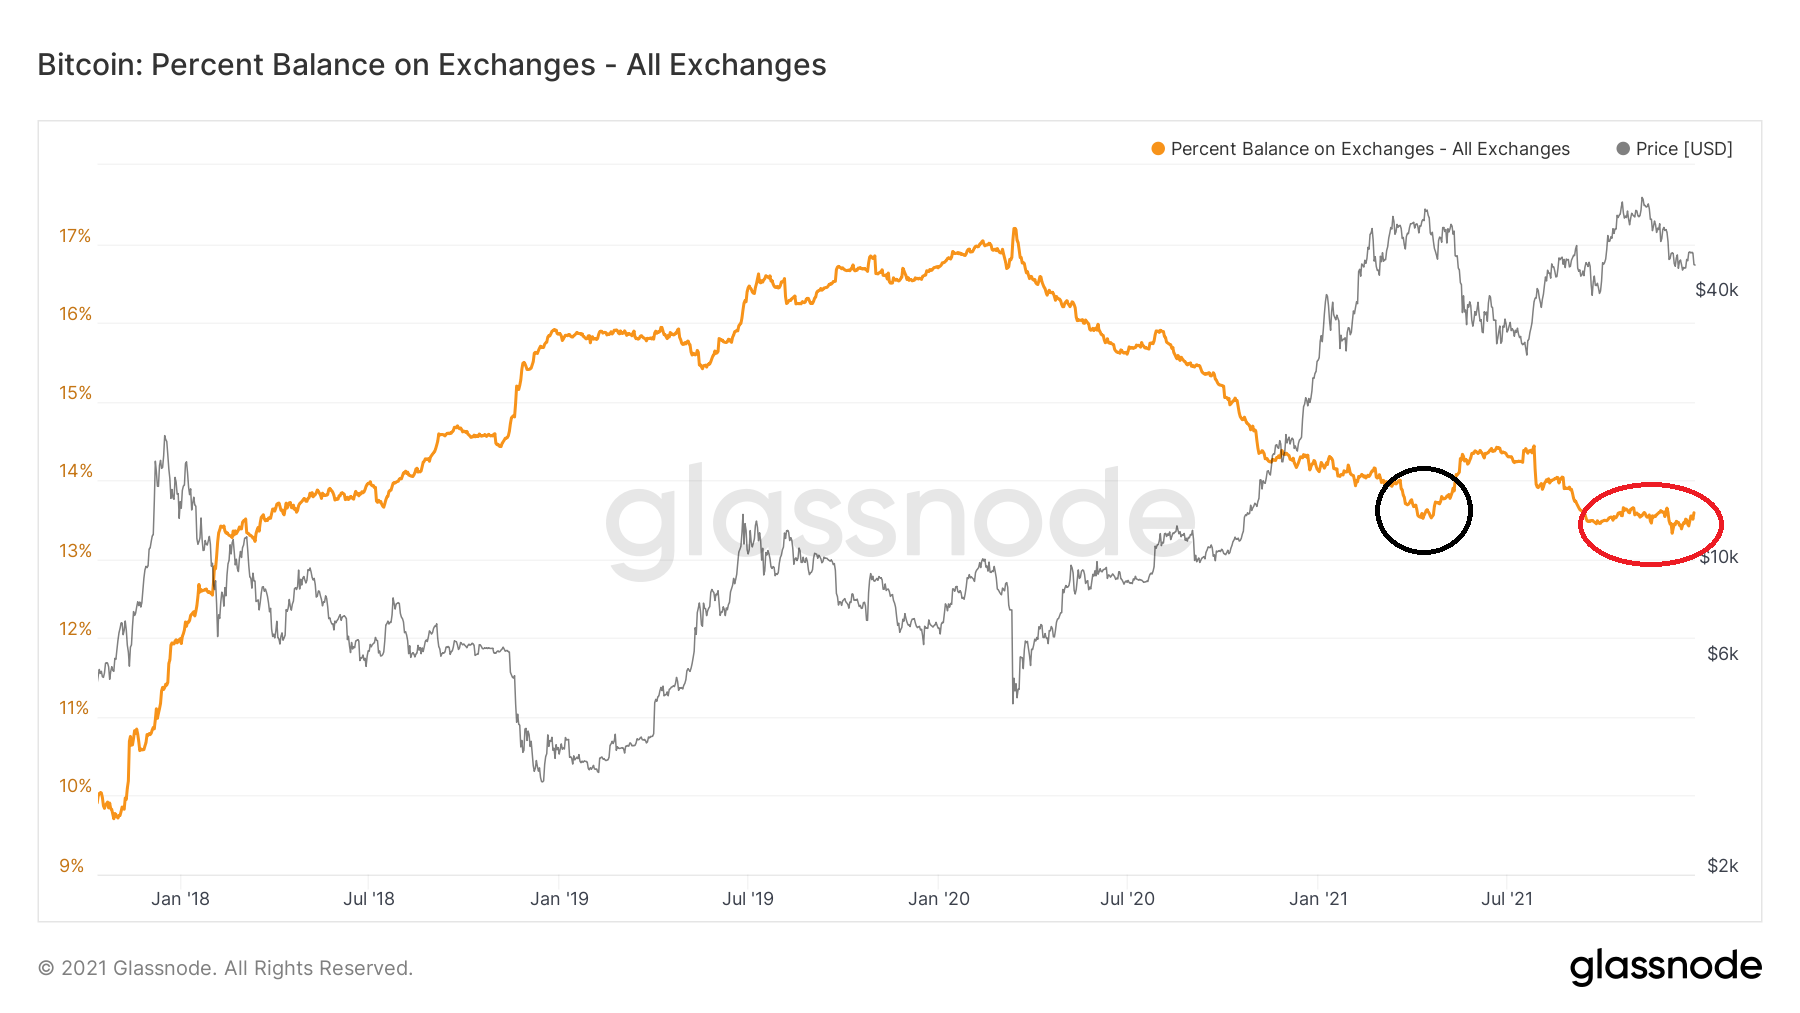
The BTC balance of exchanges
The total BTC held on exchange addresses has been declining since the start of the year. It hit a low of 13.6% on April 14 (black circle), when BTC price was near its all-time high.
Despite an initial rebound, the indicator continued to fall and hit a new annual low of 13.4% (red circle). This means that investors are probably keeping their BTC in cold storage wallets. This kind of situation is generally regarded as a bullish sign, knowing that it indicates a conviction within the market.
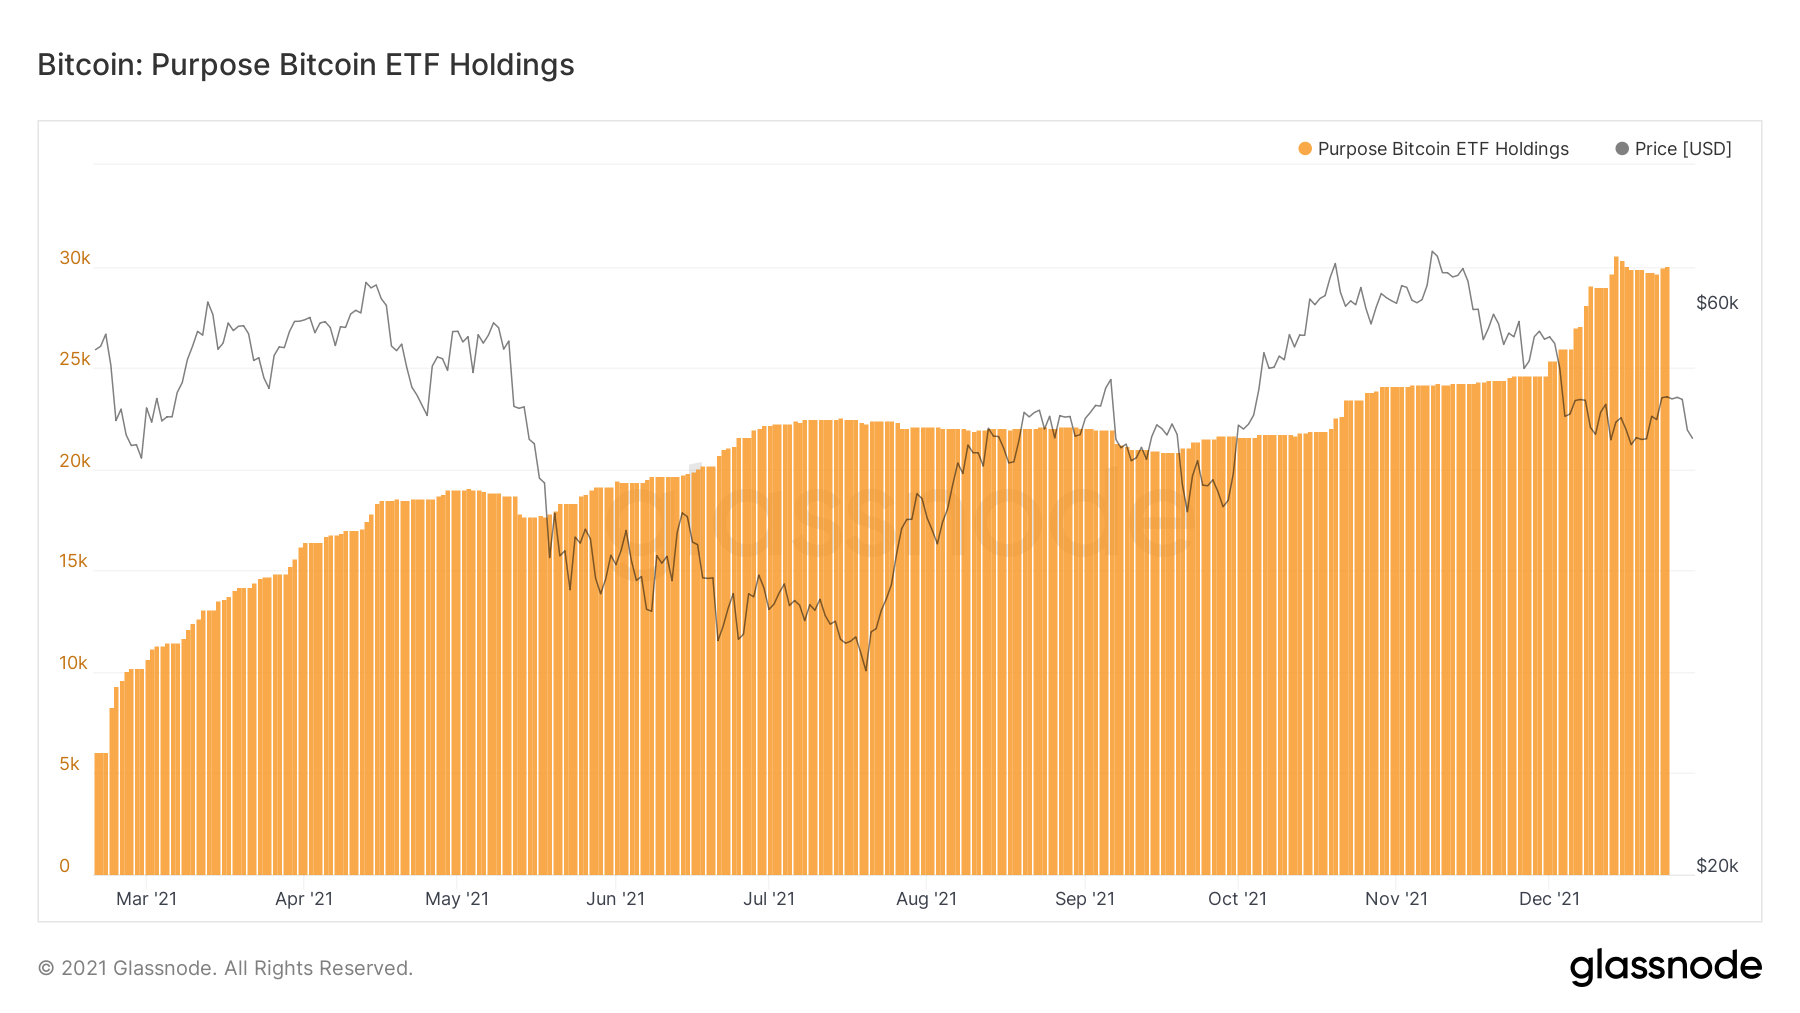
Institutional investments
ETF holdings [fonds négocié en bourse] Bitcoin Purpose have grown significantly since the start of December. This means that despite the decline in the price of BTC, institutions are buying the asset down, more specifically when its price is between $ 47,000 and $ 53,000.
On December 14, the number of BTCs in the fund reached a new all-time high of 30,528 bitcoins. Thus, institutional interest in Bitcoin remains growing.
The on-chain analyst @Wclementelll posted several charts on Twitter, which show that institutions have been more active in the market compared to retail investors. This can be seen from the fact that the volume of transfers between $ 10,000 and $ 100,000 has fallen, while those over $ 10,000,000 have increased.
This agrees with the ETF Purpose holdings charts.

Disclaimer
All information on our website is published in good faith and for general information purposes only. Any action taken by the reader based on the information found on our website is entirely at their own risk.