While Bitcoin (BTC) can increasingly recover from its weekly low in the last hours of trading, the Altcoins continue to show clear signs of weakness.
Increasing regulatory hurdles for the Binance crypto exchange caused concern among investors over the weekend. These developments overshadow the positive signals of increasing acceptance of Bitcoin (BTC) in Latin American countries. One bright spot is the relative strength of Bitcoin in the USD 30,000 range, so far every attempt by the bears to send the BTC rate towards USD 25,000 has been parried by the bulls. This means that the trading range of the previous weeks continues to exist for the time being.
Best price development among the top 10 altcoins:
Dogecoin (DOGE)
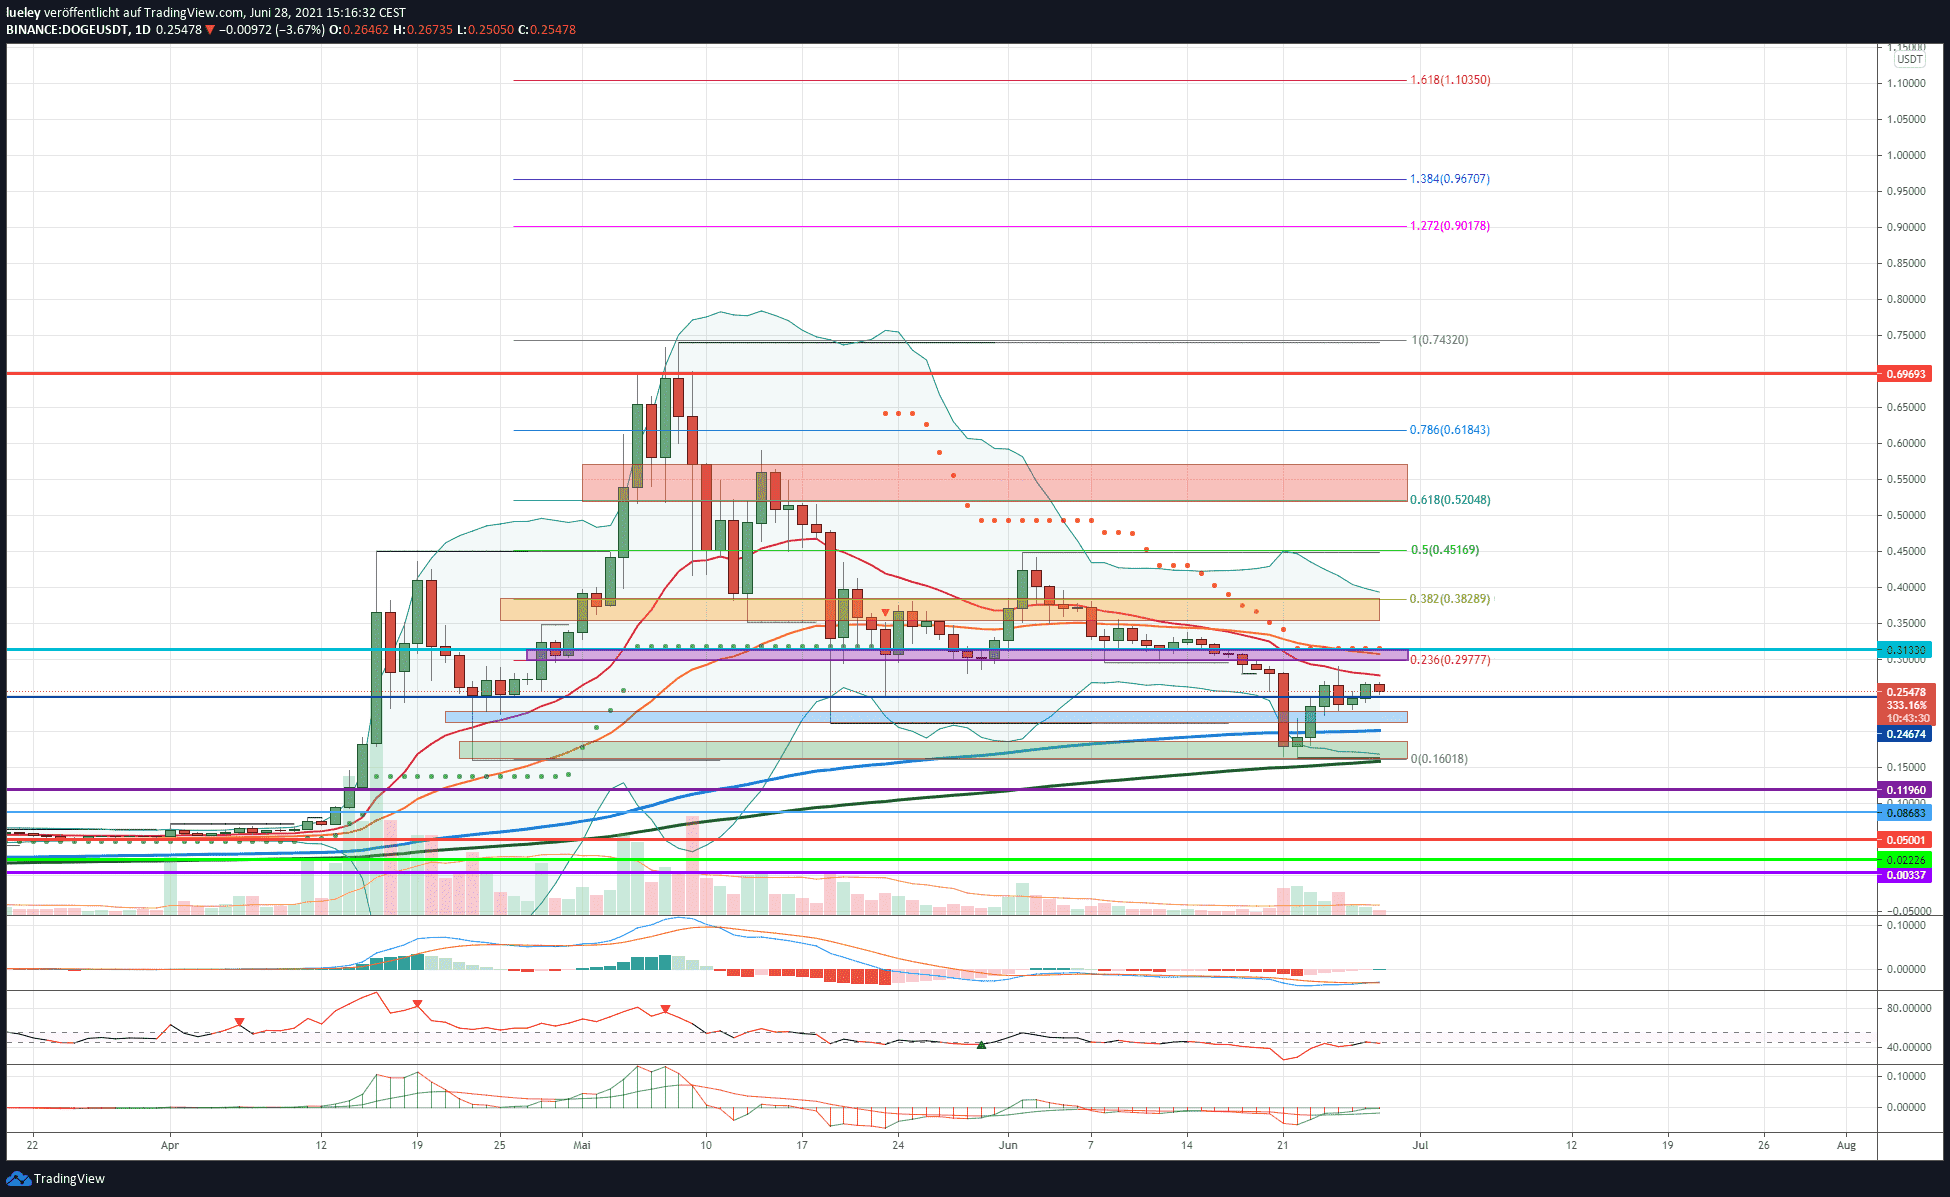
Price analysis based on the value pair DOGE / USD on Binance
Like many other Altcoins, the price of Dogecoin collapsed significantly. The DOGE price corrected to a weekly low at USD 0.16 and thus fell back to the low of April 23, before buyers came back into the market and pushed Dogecoin to the EMA20 (red) at USD 0.28 . Dogecoin is trading at USD 0.25 on Monday, June 28th, but still below the moving average of the last 20 trading days. As long as Dogecoin does not recapture the EMA20, the price potential is still limited. Only a rise above USD 0.31 brightens the chart image for Dogecoin again and could lead the DOGE price to the upper edge of the orange resistance area at USD 0.38.
Bullish variant (Dogecoin)
Dogecoin has held up relatively well in the last few days of trading and is trading at USD 0.25 above the blue support area. If the bulls manage to move the DOGE rate over the EMA20 into the purple resistance zone, another short-term decision will be made. A resistance cluster of EMA50 (orange), 23 Fibonacci retracement and supertrend can be found in the daily chart between USD 0.30 and USD 0.31. If investors manage to break this area, expect a surge into the orange resistance area between USD 0.34 and USD 0.38. If Dogecoin can break out of the orange resistance area, investors will initially focus on the 50s Fibonacci retracement at USD 0.45. Here you can find the monthly high and the 50s Fibonacci retracement of the current movement. If the DOGE price dynamically overcomes this resist zone, a march into the red resistance area between USD 0.52 and USD 0.57 is conceivable.
The rocky road back towards the all-time high
If Dogecoin does not bounce sharply down here and the resistance is broken by the daily closing price, a march to around USD 0.57 is likely. If the bulls manage to regain this resistance level, the 78 Fibonacci retracement at USD 0.62 will be the next target price. If the overall market also finds its way back to its old strength and investors heave Dogecoin dynamically above USD 0.62, a subsequent rise to the red horizontal resistance line at USD 0.70 is conceivable. A break through to the all-time high of USD 0.74 would also be realistic in the medium term. If the DOGE price breaks the all-time high and can stabilize above USD 0.74, the next price targets are activated at USD 0.90 (127 Fibonacci extension) and USD 0.96 (138 Fibonacci extension). The maximum price target for a sustainable overcoming of USD 0.96 is the area around USD 1.10. Here the course projection runs in the form of the 161 Fibonacci extension of the current course movement.
Bearish variant (Dogecoin)
If the DOGE rate does not manage to break through the EMA20 sustainably and falls back into the blue support zone in the coming trading days, the bears will lick blood again and try to head for the weekly low at USD 0.16. If this endeavor succeeds and Dogecoin slips below both moving average lines EMA200 (blue) and MA200 (green) at the daily closing price, the next bearish price target in the area of 0.12 USD will be activated. Skeptics could see themselves increasingly confirmed that the Doge rally – as they expected – will come to a bloody end. In addition, if the overall market continues to trend south in the coming period, the next support at USD 0.086 will come into focus. This is where the old all-time high of February 2021 runs.
If the bulls do not come back on the floor here either and stabilize the DOGE rate over the long term, a relapse to USD 0.05 cannot be ruled out. Dogecoin could even break down towards USD 0.022 and would have corrected its entire upward movement from 2021. However, since Dogecoin continues to enjoy great popularity among younger investors, a sale into this area is not to be expected for the time being.
Indicators (Dogecoin):
The RSI is currently trying to climb back into the neutral zone between 45 and 55 and negate its sell signal. The MACD indicator has already been able to generate a buy signal on a daily basis since this weekend. Thus, from an indicator perspective, the picture for Dogecoin is brightening up again.
Worst price development among the top 10 altcoins:
Polkadot (DOT)
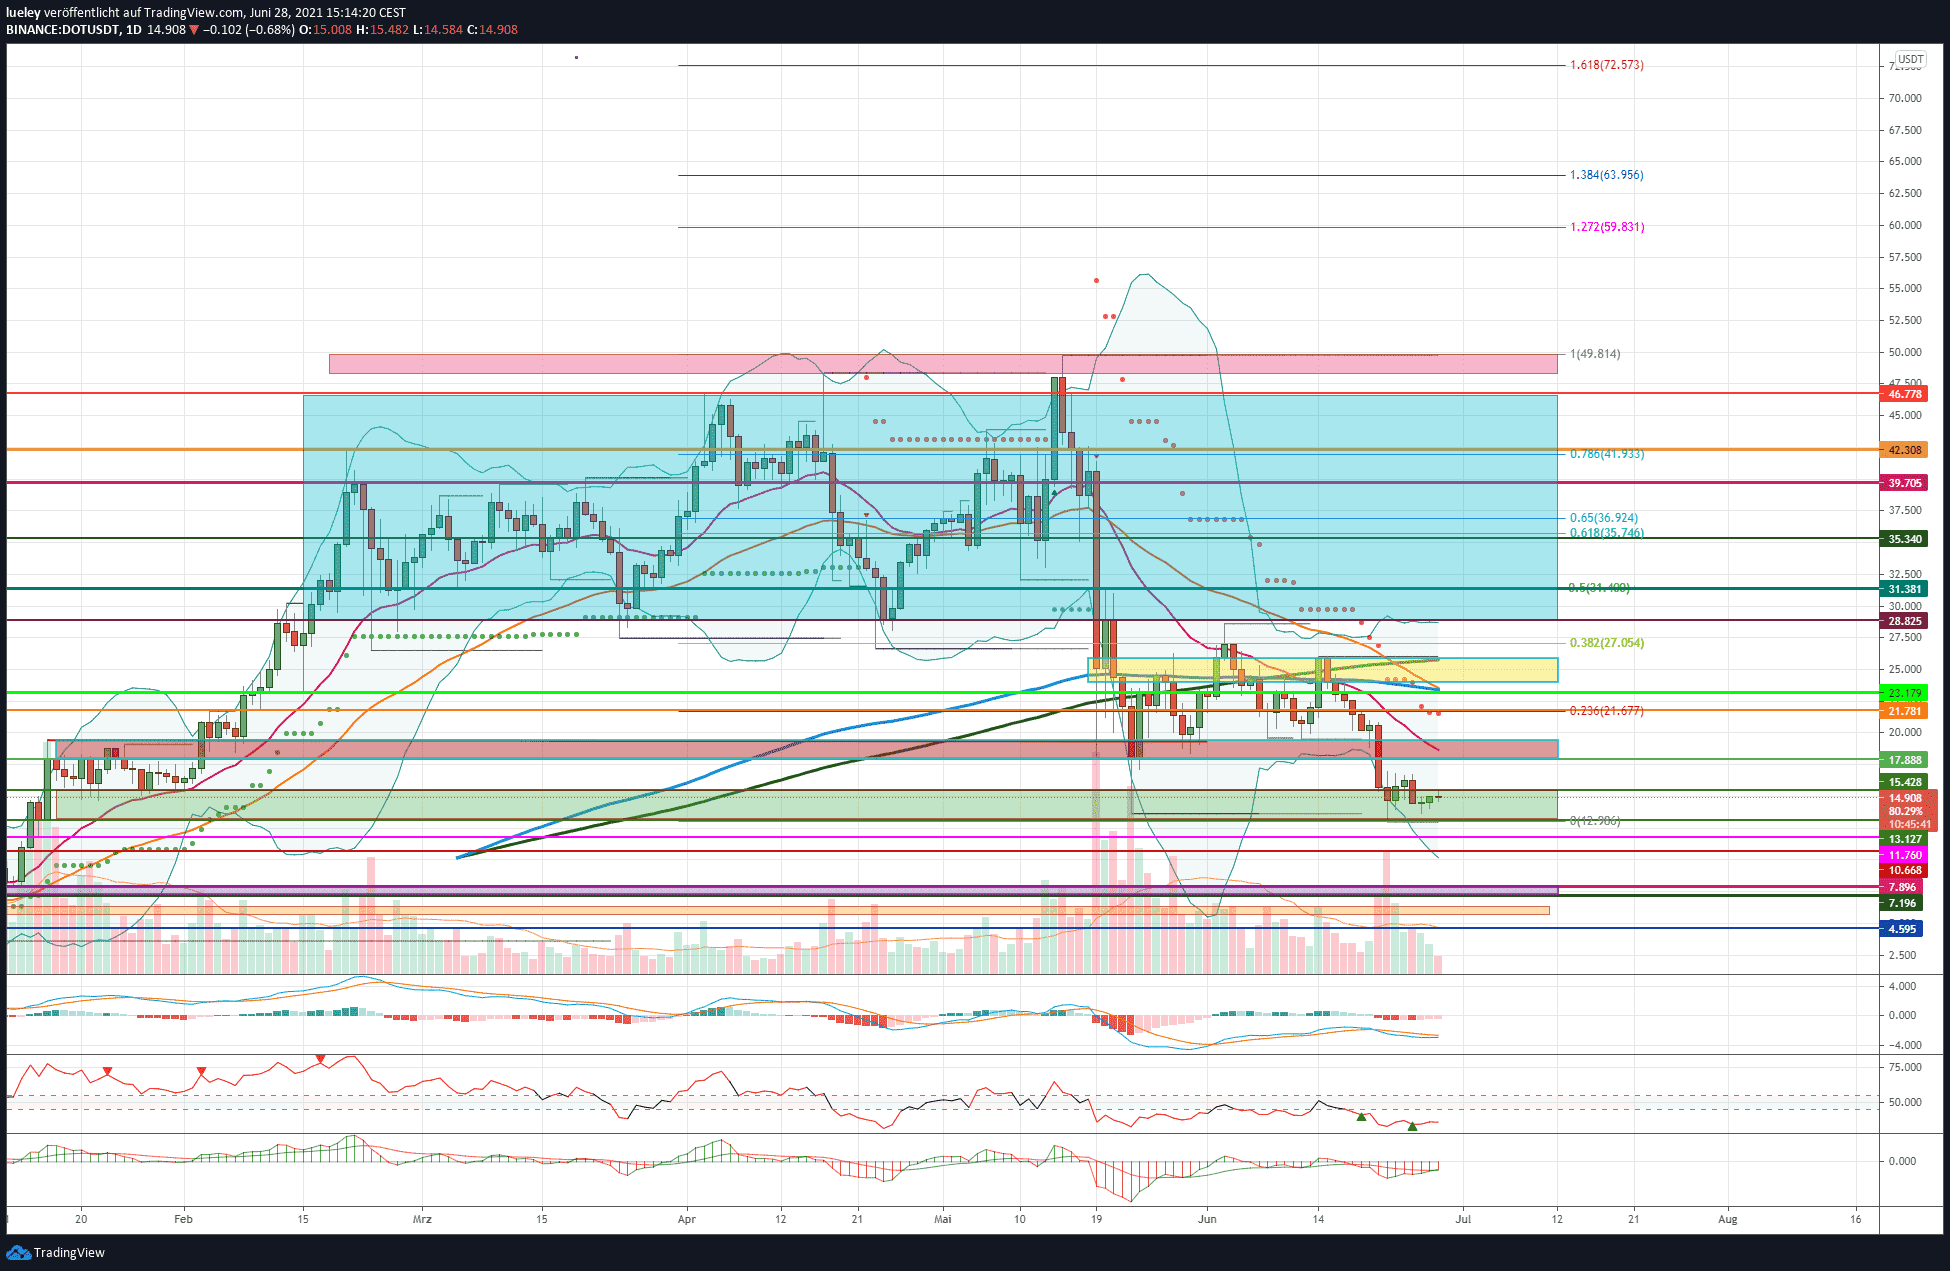
Price analysis based on the value pair DOT / USD on Binance
The Polkadot course came under the wheels again this week. After Polkadot failed to climb back above the major moving resistance levels EMA200 (blue) and MA200 (green), Polkadot remains bearish. With a weekly loss of 26 percentage points, the DOT price continues to trade in the area of its low of April 23 at USD 13.60. Polkadot has been able to recover slightly to currently USD 14.89 in the last few trading days, but has not yet managed to break out of the green support area.
Bullish variant (polkadot)
The bulls were able to avert a total crash in the area of the history lows from the end of January 2021 this week. As long as the DOT price cannot rise back to the horizontal resistance at USD 17.88, there is a further threat of a correction to the south if the overall market weaknesses again. Should the bullish investors manage to move Polkadot above USD 17.88 and also dynamically overcome the EMA20 (red), an increase to the cross resistance at USD 21.67 is conceivable. The 23rd Fibonacci retracement and the supertrend in the daily chart run here. This price level thus represents a strong resistance zone. If this resistance is broken above, the next target will be 23.17 USD. The EMA50 (orange) and the EMA200 (blue) can be found here. A breakout above this resistance level is therefore not to be expected at the first attempt. However, if the bulls manage to regain this price level in the coming weeks, there will be another exchange of blows between bulls and bears at USD 26.
Increase scenario towards all-time high
In addition, the 38 Fibonacci retracement of the current price movement is already running at USD 27.05. If, contrary to expectations, this resistance is regained by the daily closing price, a march through to USD 28.82 is conceivable. The upper Bollinger band and the trailing edge of the current corrective movement can be found at this course mark. A rise back into the blue sideways phase would be seen as an important partial success. Polkadot should then continue to march through to the Fibonacci 50 retracement at USD 31.38. Should Bitcoin be able to heave the overall market north again in the coming period, Polkadot could also target its next price target at USD 35.34. Just above this resist, the “golden pocket” of the 61 and 65 Fibonacci retracement runs between USD 35.74 and USD 36.92. In this area at the latest, increased resistance from the bears can be expected again. If profit-taking is limited and the bulls will also overcome this resist zone in the medium term, new price targets will be activated at USD 39.70 and USD 42.30. For the coming weeks, these resistance levels represent the maximum price targets on the upside. Only when the overall market recovers sustainably, a march through to the old all-time high of USD 46.77 would be conceivable as a maximum price target.
Bearish variant (polkadot)
If, on the other hand, Polkadot does not manage to start at least the 23rd Fibonacci retracement and already bounces off dynamically at USD 15.42, but at the latest at USD 17.88, an expansion of the correction movement is quite likely. If the bears then manage to dynamically break the low of USD 12.98, Polkadot should break down to at least USD 11.76 or USD 10.66. Particular attention should be paid to the USD 10.66. The outbreak level of January 13, 2021 can be found here. If the bulls cannot stabilize the DOT rate here, there is a threat of a further price slump. A relapse into the purple support area between USD 7.89 and USD 7.19 should be planned.
If the weakness in the overall market continues and Bitcoin falls back to around USD 20,000, Polkadot should target the orange support area between USD 6.33 and USD 5.72. A sustained overall market weakness could subsequently even correct the DOT rate to the maximum bearish price target of USD 4.59. However, as long as Polkadot can hold its ground above USD 12.98, a recovery move back to the EMA20 is to be favored for the time being.
Indicators (polkadot):
The RSI as well as the MACD indicator have active sell signals this week as well. The RSI indicator in particular, with a value of 36, is not far from its oversold area. The bulls’ goal must be to get the RSI indicator back into the neutral zone between 45 and 55 as quickly as possible. Only then would the danger of a further downward movement be averted for the time being.
Top 10 stability
Despite a persistent price weakness, Bitcoin can still pull itself out of the affair with a 5 percent price discount. On the other hand, all top 10 altcoins are losing double-digit value. Dogecoin (DOGE) can assert itself the most with a price decline of 10 percentage points. The Binance Coin (BNB), Ethereum (ETH) as well as Litecoin (LTC) and Bitcoin Cash (BCH) are also doing slightly better than the overall market, each with a price drop of less than 20 percent. The weekly loser Polkadot (DOT) has to give way a lot more and falls behind by 26 percentage points. Uniswap (UNI) is also very bearish and has a price discount of around 23 percentage points. Looking at the ranking of the top 10 altcoins, there are three changes in place. Bitcoin Cash (BCH) and Litecoin (LTC) each jump up one place to 8th and 9th place and displace the decentralized exchange Uniswap to tenth place.
Winner and Loser of the Week
The weakness in the overall market continues this week. Following the crypto loan currency Bitcoin, almost all top 100 altcoins lose value. Around 90 percent of the 100 largest cryptocurrencies show some significant price discounts on a weekly basis. Only Quant (QNT) can successfully counter the bearish trend on the overall market with a 16 percent price gain. The long list of weekly losers is headed by Kusama (KSM) with a 35 percent discount. He is followed by the outperformer of the past few weeks, Amp (AMP), with a price decline of 34 percent. Near (NEAR), NEO (NEO) and Theta Fuel (TFUEL) also fell by around 30 percent each week.
More than half of the top 100 altcoins show a price drop of 20 or more percentage points. As a result, the majority of the Altcoins lose much more of their value than Bitcoin. This tendency is also reflected in the increasing dominance of the crypto reserve currency. For the time being, the bear camp still has a firm grip on the market. In the event of a persistent weakness in the Bitcoin exchange rate, the Altcoins threaten to lose further ground and generate new lows in the future.
Disclaimer: The price estimates presented on this page do not constitute buy or sell recommendations. They are only an assessment of the analyst.
The chart images were created using TradingView created.
USD / EUR exchange rate at the time of going to press: 0.84 euros.