
Since the Russian invasion of Ukraine on February 24, Bitcoin (BTC) has evolved curiously in apparent calm. Some investors would almost start to believe in its decorrelation to financial stress. Unfortunately, the facts prove them wrong until further notice. Indeed, gold has practically returned to its last ATH while BTC for its part is struggling to extricate itself from its major resistances.
As it stands, it is best to take with a grain of salt the resilience of the King of Cryptos due to a lack of performance history in a war event. It makes you wonder if the market is tempering to prepare for a continuation of the bear run that began in November 2021.
This Bitcoin price analysis is brought to you in collaboration with the Coin Trading and its algorithmic trading solution finally accessible to individuals.
Bitcoin plays scare in weekly units
The head-to-shoulder (ETE) neckline around $41,000 appears to be a restraining force against multiple bounce attempts so that the bearish chart pattern has been validated for a few weeks. Investors should take note of this negative technical signal which attests that the downtrend since its last ATH in November 2021 is firmly anchored, despite a period of stability since January 24th.
We are gradually moving towards neutralizing the bull cycle since 2019. The last three weekly candles (orange dot), including this week’s, show us that Bitcoin remains stuck inside the Kumo (cloud) to the point of flirting with its lower limit, the Senkou Span B (SSB). At the same time, the Chikou Span, the ultimate pillar of Ichimoku, is likely to remain inside the cloud for quite a while depending on the next price movements of BTC.
And let’s assume that a rebound can take place quickly with the respective crossing of the ETE neck line and resistance around $46,000. The buyers would not be on conquered territory because of the Kijun which is at the level of the resistance around $51,000-52,000 and the upper limit of the Kumo, the Senkou Span A (SSA).
In the opposite case, the passage of BTC under the Kumo would lead to a revisit of the low points of the end of last January and why not, a slippage towards the support around $30,000 if Vladimir Putin should cross another red line on the Russian-Ukrainian conflict.
Bitcoin unable to cross the Kumo
Last week, I mentioned the fact that Bitcoin is currently oscillating in a horizontal channel (orange rectangle) between support around $34,000-35,000 and resistance around $46,000 since January 24. Between the two terminals, the neck line of the ETE separates the upper and lower part of the horizontal channel. This status quo results in Bitcoin prices being unable to cross the Kumo in daily units (green dots).
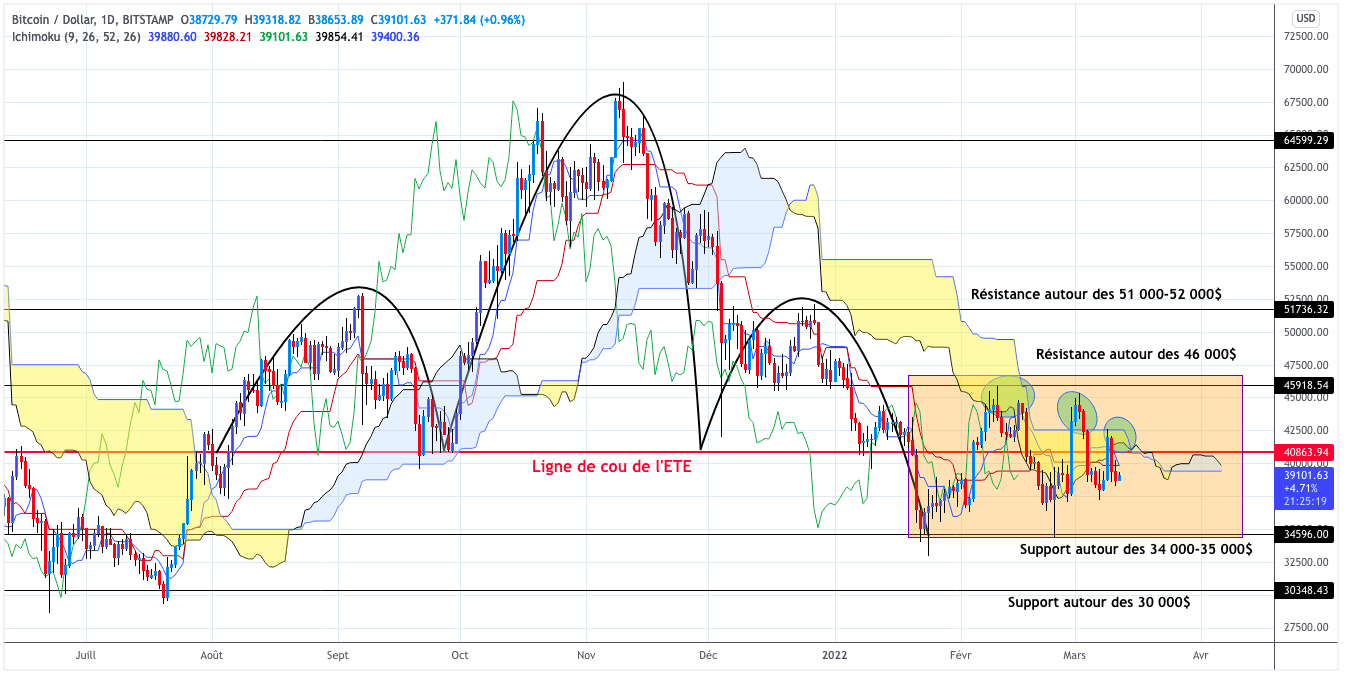
Now they are thrown back under the Kumo, Tenkan and Kijun respectively to return to the lower part of the horizontal channel while the Chikou Span remains below the cloud. Enough to satisfy the bearish impulses towards the support around $34,000-35,000. Which wouldn’t change the current situation. but be careful not to go beyond this key level that buyers are keen to defend. Otherwise, head for $30,000!
In summary, and by dint of repeating myself from another angle, the apparent calm of Bitcoin even before the Russian invasion, should be put into perspective, as it follows a drop of almost 50% in its market capitalization since its last ATH . Let’s stop bulging our chests at the slightest rise in the king of cryptos if the catalysts give birth to a mouse. Let’s be clear! We need concrete information on the development of the Russian-Ukrainian conflict and the probable announcement of a rate hike at the Fed’s meeting on March 15 and 16.
As long as these two uncertainties are not completely lifted, Bitcoin would be more likely to drag in the horizontal channel or come out of it from below, in which case we would see a new downward wave, synonymous with the continuation of the bear run. It would reflect the accumulation of negative technical signals seen since the breakout of the former critical zone around $51,000-52,000.
Is it possible to be gwinner every time? Whether the Bitcoin price is in great shape, or going through turbulence, Coin Trading offers you to increase your chances of success. Indeed, Trading Du Coin allows individuals to access an algorithmic and 100% automated trading tool. A real trend mechanism, this tool has been designed to adapt to market reversals and position itself on the most dynamic crypto assets of the moment.