Bitcoin price and BTC dominance are weakening. The seller side is building up increasing pressure and could thwart the big price target for 2021.
Bitcoin (BTC): Price weakness could accelerate
BTC course: 55,971 USD (previous week: 60,150 USD)
Resistance / goals: $ 57,998, $ 59,299, $ 61,771, $ 63,724, $ 64,896, $ 66,299, $ 67,416, $ 69,000, $ 70,856, $ 76,472, $ 77,678, $ 85,563, $ 87,090, $ 89,982, $ 100,259, $ 114,961
Supports: $ 55,817, $ 54,077, $ 53,005, $ 51,307, $ 49,555, $ 48,222, $ 47,070, $ 45,993, $ 42,855, $ 40,585, $ 39,240
The Bitcoin rate is still in consolidation mode. The relapse below the supertrend and the abandonment of the EMA50 (orange) in the daily chart resulted in a correction widening to support at USD 55,970 in the last few days of trading. Although this support has so far been defended on a daily basis, a closing price below this price level could develop further downside potential. A first directional decision can be expected in the area of the orange support zone between USD 54,077 and USD 53,005.
As long as Bitcoin can defend this support area, the bulls still have every chance to lead Bitcoin price back towards the all-time high in the coming weeks. However, it is currently also important to closely monitor the development of interest rates on government bonds in the USA. Should the US Federal Reserve (FED) raise interest rates faster than market players suspect, investors could withdraw funds from high-risk assets such as Bitcoin. This tendency was already evident in the last few days of trading in the Nasdaq technology index, where investors were increasingly throwing well-performing stocks such as Amazon, Google and Co. out of their portfolios. The recent strength of the dollar is also exerting increasing pressure on the entire financial market, as can be seen in the clear price corrections in the precious metals gold and silver.
Bullish scenario (Bitcoin price)
The bulls recently failed to stabilize the BTC rate on a sustainable basis. Only a recapture of the red resistance zone including recapture of the EMA20 (red) ensures a short-term all-clear. Then it is also important to dynamically recapture the resistance at USD 61,771. If the bulls manage to heave the Bitcoin price above this price mark, another important technical hurdle awaits between 63,724 USD and 64,896 USD. In particular, the USD 64,896, where the supertrend is currently running, represents a central hurdle on the way back towards the all-time high. Only when this resistance can be overcome by the daily closing price, the USD 66,299 comes into focus. Here the BTC rate failed on November 15th. If the buyer can build up enough pressure to sustainably break through this resist, the chance of a subsequent increase up to the all-time high increases significantly.
If the current high of 69,000 USD is overcome, Bitcoin aims at the price target of 70,856 USD, which has been repeatedly mentioned. If the BTC rate then clings above the psychological USD 70,000 mark, the medium-term price targets for the coming months of USD 76,472 and USD 77,678 come into focus. From this level a correction back towards USD 70,000 can be expected. However, as long as the Bitcoin exchange rate is not corrected more clearly and falls sustainably below USD 70,000, a subsequent increase into the repeatedly rumored target zone between USD 87,090 and USD 89,982 cannot be ruled out. Although a march towards the 361 Fibonacci extension at USD 100,259 cannot be ruled out by the end of the year, the current mixed situation on the financial market could thwart this scenario. Reaching the long-term price target at USD 114,961 (Fibonacci extension 461) has to be pushed back for the time being.
Bearish scenario (Bitcoin rate)
The bears are still on the trigger for a short time. Lower highs and lower lows in the daily chart speak for themselves. Having key support abandoned by the bulls at $ 57,988 increases the chance for the current consolidation to expand. A daily closing price below USD 55,817 makes a sell-off into the orange support area between USD 54,077 and USD 53,005 increasingly likely. This zone represents the breakout level of the current trend movement. The bulls should defend this zone as much as possible in order to avert a relapse into the blue support zone between USD 51,307 and USD 49,555. A correction back to this area has a signaling effect and indicates increasing strength on the seller side. In particular, USD 49,555 represents strong support. The EMA200 (blue) and the overarching red upward trend line are currently running here. However, if the Bitcoin price does not stabilize in this area either, the make-or-break level at USD 48,222 comes into focus.
A break of this price level activates the 47,070 USD as the next relevant support. If there is no bullish backlash here either, the correction will immediately extend to the MA200 (green) at USD 45,992. This price mark represents almost the last potential turning point for the buyer side. If the bulls do not come back here, the downward momentum could accelerate again. Bitcoin is likely to drop to USD 42,855 as a result. The 38th Fibonacci retracement of the higher-level upward movement runs here. If this support level is also dynamically undershot, the trend low from September 2021 at USD 40,585 comes back into focus. If Bitcoin reaches this support and subsequently falls below it, a relapse to USD 39,240 cannot be ruled out. A sustainable task would end the upward trend instantly. A sale back to the 30,000 USD can then no longer be ruled out.
Bitcoin dominance with a new trend low
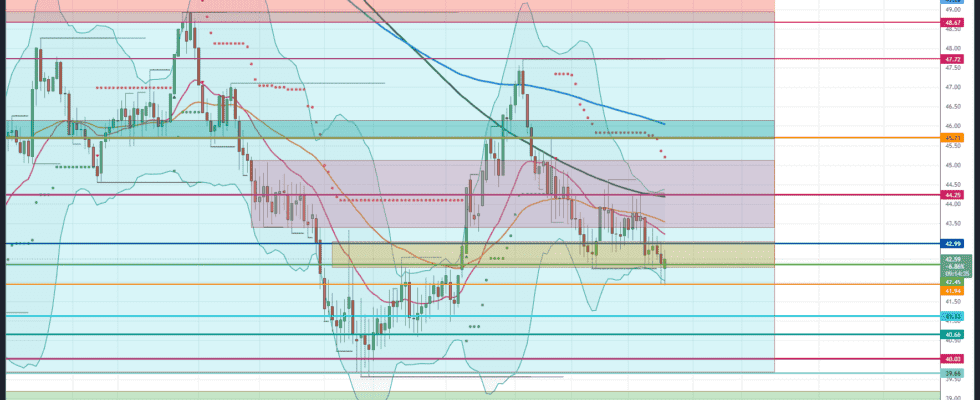
Bitcoin dominance failed to overcome the strong cross-resistance at 44.25 percent and subsequently slipped back towards 42.45 percent. The fact that the BTC dominance was also unable to break through the EMA20 (red) and EMA50 (orange) at the end of the day indicates a clear weakness. If the dominance does not rise promptly back towards 42.99 percent and falls below the weekly low at 41.94 percent, the correction movement threatens to expand.
BTC Dominance: Bullish Scenario
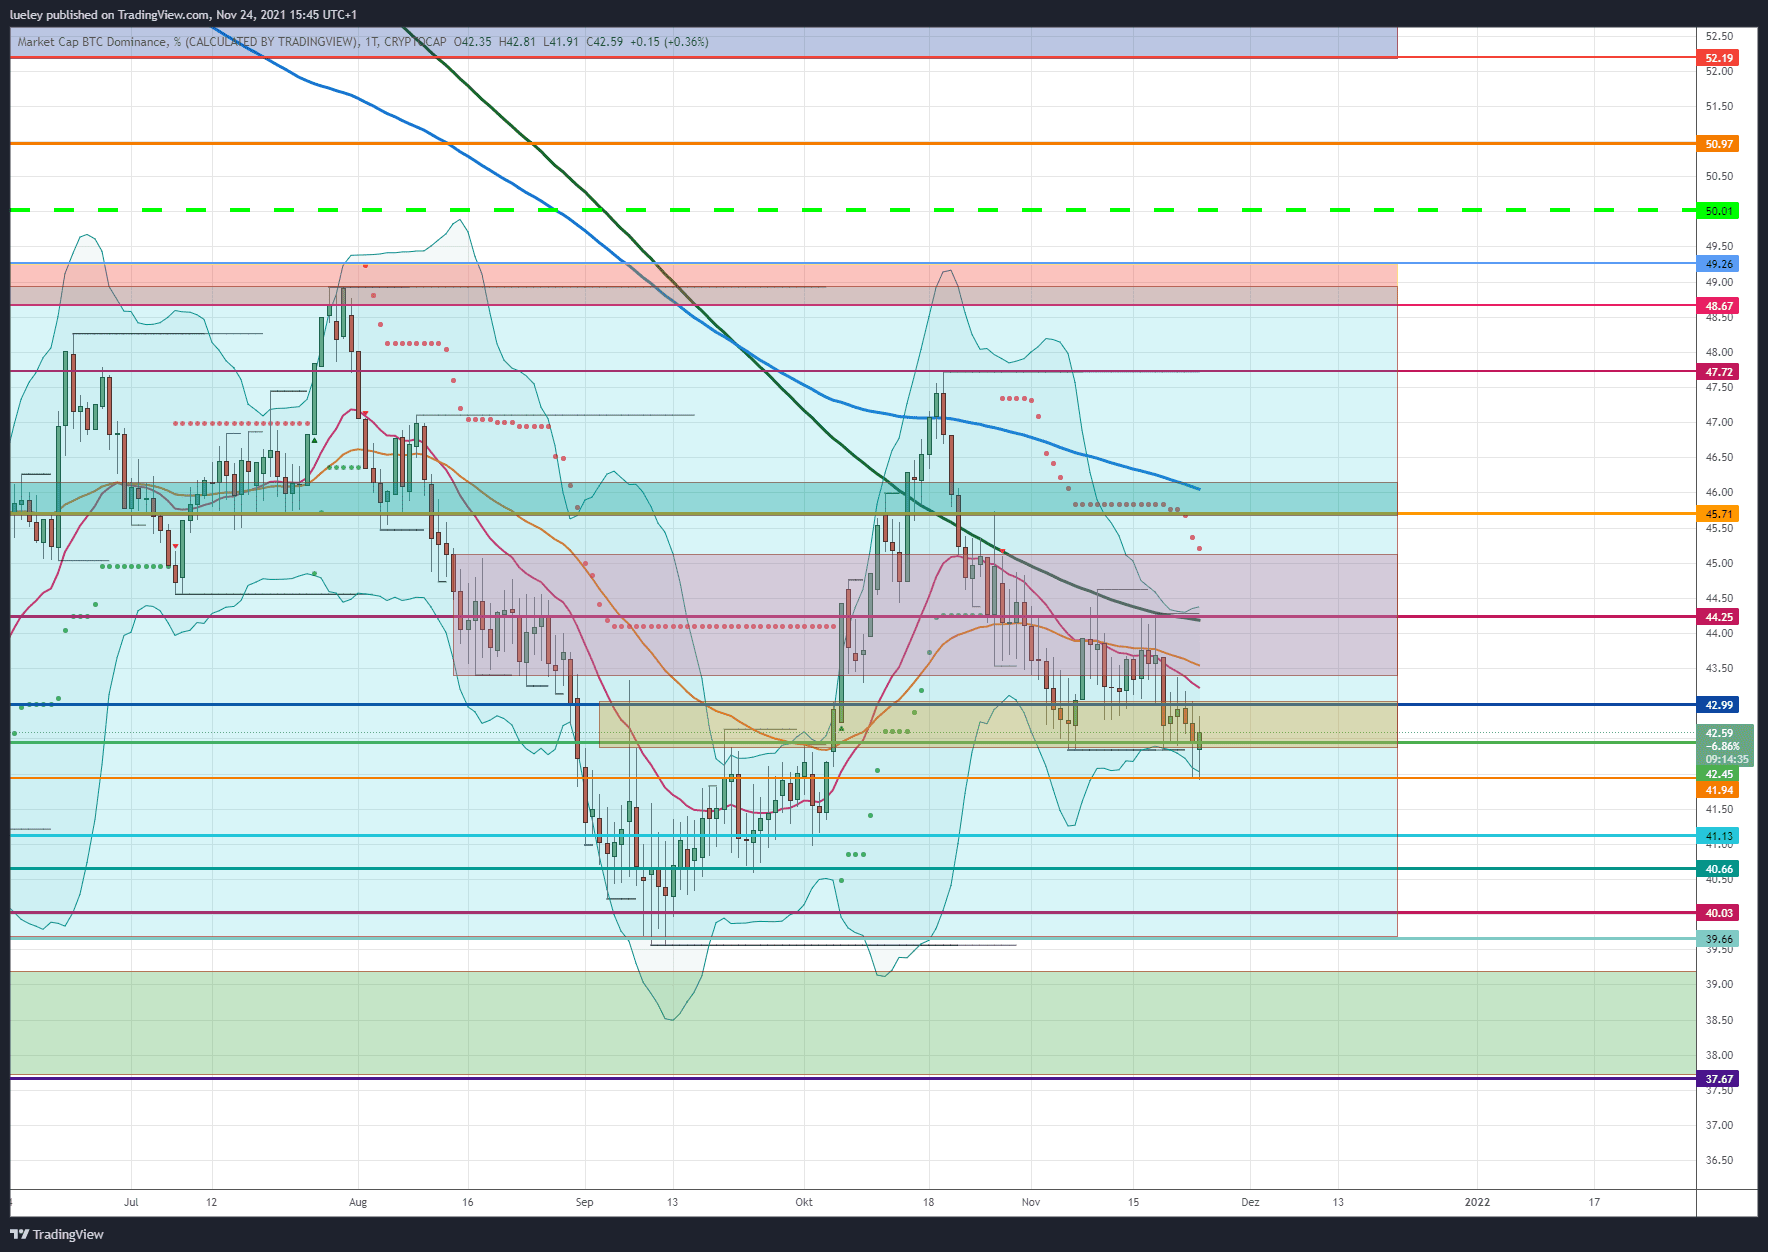
The rebound from the strong resistance at 44.25 percent caused a significant correction in Bitcoin dominance in the last seven trading days. The fact that the BTC dominance was also repeatedly unable to increase on a daily basis above the EMA20 and EMA50 has caused a significant drop in the last few days to below the strong support at 42.45 percent. In order to break this downtrend, the price must regain this chart level as soon as possible. Only when the 42.99 percent upwards can be broken is a slight all-clear to be given. However, the BTC dominance must then regain both moving resistance levels in order to generate upside potential back to 44.25 percent. If this strong resistance can subsequently be broken, the top edge of the red box comes back into focus at 45.05 percent. The supertrend in the daily chart is currently also running here – a strong hurdle.
Should the Bitcoin dominance break out of the red box in the medium term, a breakthrough of up to 45.71 percent is conceivable. If this brand manages to overcome market dominance, a directional decision is made in the blue box. Only when the blue resistance area is overcome, a march through to the EMA200 (blue) at 46.32 percent should be planned. Should this resistance level be regained, the chart will brighten up significantly. Then the course high at 47.72 percent is activated as a target. If there is no clear setback here either, an increase up to 48.67 percent and 49.26 percent is possible. For the time being, this area is to be seen as the maximum price target on the upside.
BTC Dominance: Bearish Scenario
As already discussed in the previous week’s analysis, the strong rebound at 44.25 percent led to a significant reduction in Bitcoin’s market power. The fact that the low of 42.45 percent has since been abandoned and the BTC dominance is currently continuing to decline has a clearly bearish character. If the Bitcoin dominance falls below its current weekly low of 41.94 percent, a relapse to the October low of 41.13 percentage points is likely. If the course does not turn up here, the 40.66 percent will come into focus immediately.
Thus, the probability of a retest of the 40 percent mark also increases significantly. If the Bitcoin dominance cannot shake off the ongoing weakness, a renewed test of the annual low at 39.66 percent is likely. If the annual low then breaks, a further trend acceleration should be planned. A relapse of up to 37.67 percent would be conceivable. The current decline in Bitcoin dominance is increasingly playing into the cards of the Altcoins. This can be seen when looking at the price development of many Altcoins in the last 2 trading days.
Disclaimer: The price estimates presented on this page do not constitute buy or sell recommendations. They are only an assessment of the analyst.
The chart images were created using TradingView created.
USD / EUR exchange rate at the time of going to press: 0.89 euros.