At the start of the week, the entire crypto market has to cope with significant price drops. The weakness of the crypto-key currency Bitcoin (BTC) also means that most Altcoins are falling significantly.
Many Altcoins were able to recover a little from their price drops of the previous week at the weekend, but slide more strongly towards the south in the course of the Bitcoin weakness in the last hours of trading. As long as Bitcoin does not drop below the previous week’s low in the area of USD 42,923 at the daily closing price, investors must remain calm for the time being. Nevertheless, it is advisable to hedge existing profits. The overall market is still waiting for news in the area of regulation and taxation of crypto assets as well as the difficult situation in the real estate sector in China, the outcome of which remains uncertain.
Best price development among the top 10 altcoins:
Avalanche (AVAX):
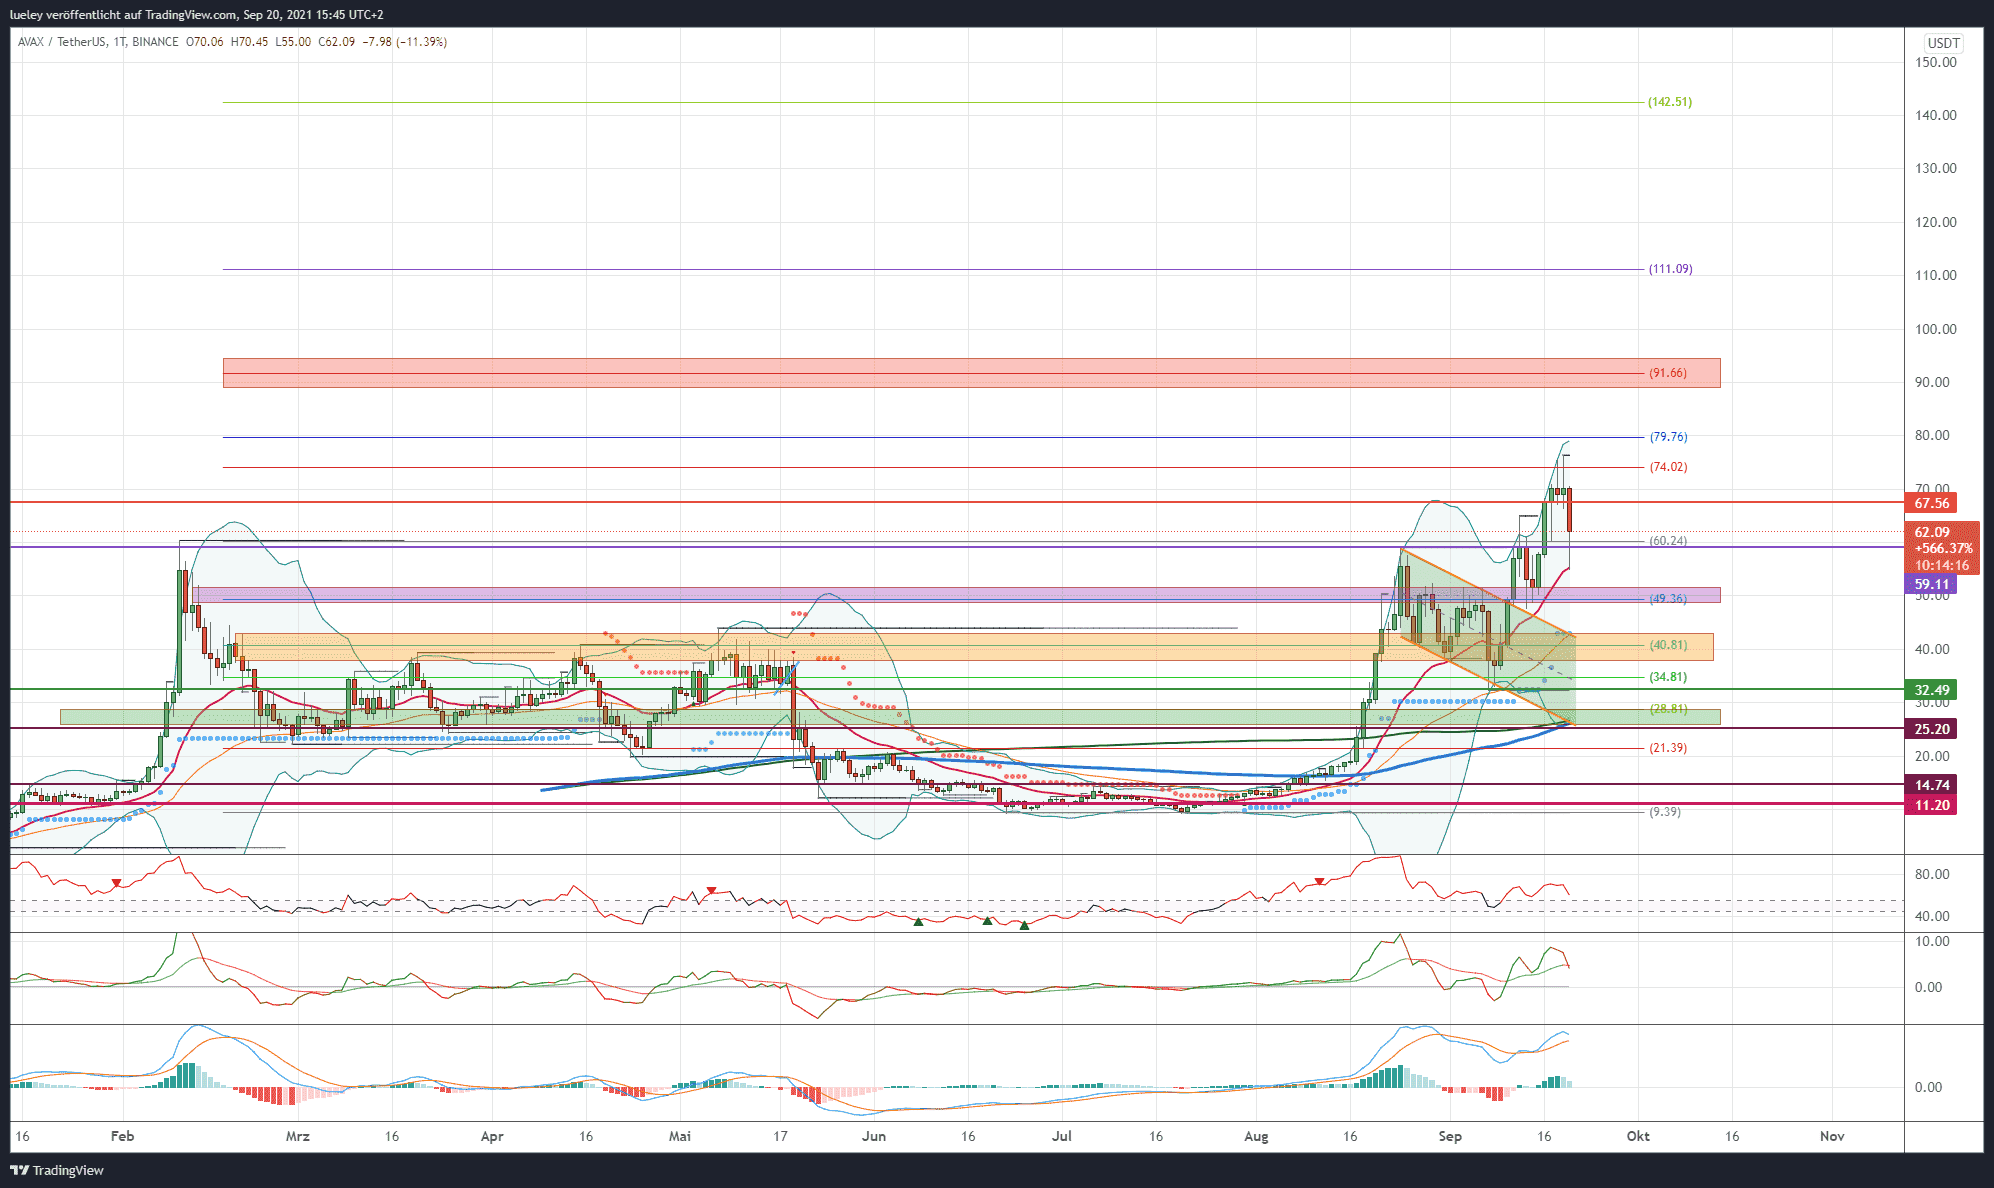
Price analysis based on the value pair AVAX / USD on Binance
The price of the newcomer among the top 10 Altcoins, Avalanche, also has to give way in the last hours of trading after a strong previous week’s performance. On a weekly basis, however, AVAX can at least show a slight price increase of around seven percent and is thus stronger than large parts of the overall market. The AVAX price hit its first major Fibonacci extension at $ 74.02 on the weekend before increased profit-taking. As long as Avalanche can stabilize above USD 55.01 (EMA20) (red), the gaze is directed further north.
Bullish variant (Avalanche)
The current price weakness on the overall market also allows Avalanche to consolidate more clearly. As long as the bulls manage to stabilize the AVAX rate above USD 50.00, ideally even north of USD 55.51, further price increases are conceivable in the future. Then a new attempt to climb up to USD 67.56 should be planned. If this resistance is also overcome, the area of the all-time high between USD 74.02 and USD 79.76 will come into focus again. Only when the 138 Fibonacci extension can also be broken at the daily closing price will there be new price potential in the direction of the 161 Fibonacci extension at USD 91.66. Profit-taking is likely to occur again here. Should this strong resistance be overcome in the future, the next target price will be activated at USD 111.09. This is where the Fibonacci 200 extension can be found. The maximum price target for the coming weeks is the resistance level at USD 142.51. Here is the 261 Fibonacci projection of the current upward movement.
Basic variant (Avalanche)
On the other hand, if the AXAX rate continues to correct and slides back below its breakout level at USD 59.11, an initial directional decision will be made at the EMA20 (red). If Avalanche dynamically undercuts USD 55.01, a relapse into the purple support area should be planned. This is also where the breakout level from the bullish flag of September 11th can be found. If there is no resistance from the buyer camp, a retest of the cross resistance from Supertrend and EMA50 (orange) at USD 42.88 should be pending. If the bears manage to undercut this support dynamically, price targets will activate in the area of the lower edge of the orange support area at USD 37.85. If this zone is also given up on a sustained basis, the trend low at USD 32.49 comes into focus.
If the correction continues to widen in the coming weeks, a consistency test of the green support zone between USD 28.31 and USD 25.20 is conceivable. If, contrary to expectations, this central support area is abandoned, a fallback to the maximum bearish price target of USD 21.39 cannot be ruled out. This is where the 23 Fibonacci retracement and the starting point of the dynamic rally at Avalanche can be found. For the time being, however, a relapse into this chart region is to be regarded as unlikely. The chart could suddenly cloud over if Bitcoin breaks down well below USD 38,000.
Indicators (Avalanche):
The RSI as well as the MACD indicator continue to show a buy signal in the daily chart, but are currently trending south. An expansion of the course correction could lead to the formation of fresh sell signals in the coming trading days.
Worst price development among the top 10 altcoins:
Terra (LUNA)
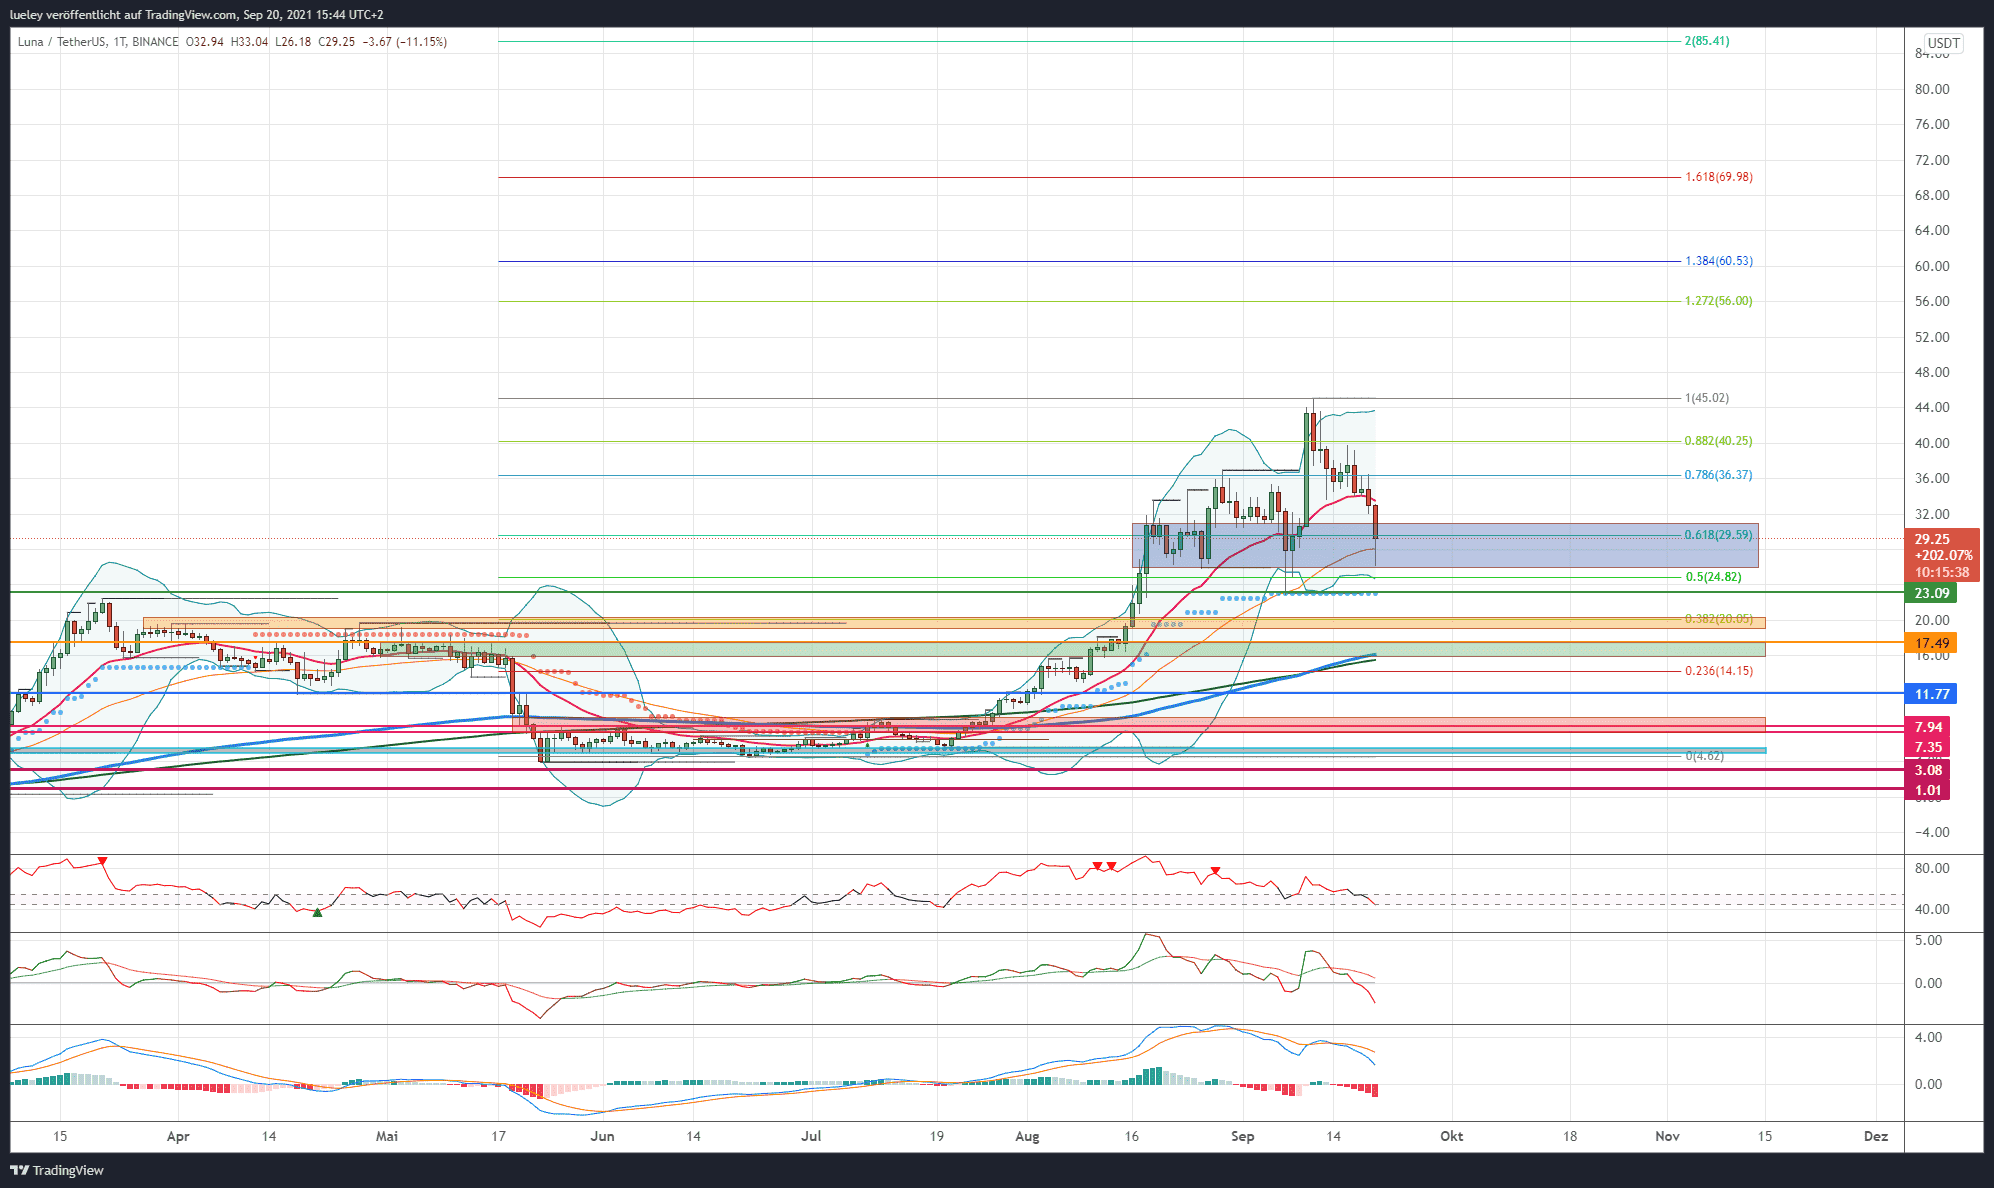
Price analysis based on the value pair LUNA / USD to Binance
The course of Terra has to cope with significant price drops this week. With a minus of around 25 percentage points, the LUNA rate slipped well below its EMA20 (red) and on Monday morning even fell temporarily below the EMA50 (orange). Currently, however, Terra can easily break away from its daily lows and thus recapture the EMA50 (orange) for the time being. In this way, the break in the blue zone could also be averted for the time being.
Bullish variant (Terra)
After rising to a new all-time high at USD 45.02, the LUNA rate currently has to cope with a significant decline. The aim of the bulls must now be to stabilize the course at the latest in the area of the lower edge of the blue area. A short nightcap up to 23.09 USD would be imaginable. At this point at the latest, buyers have to show their colors. If the bulls manage to stabilize the LUNA rate above the EMA50 at USD 27.95, an attack back to USD 31.00 is of great relevance. If the recapture succeeds, the EMA20 (red) comes back into focus at USD 31.31.
Only when Terra dynamically recaptures this sliding resistance and subsequently also overcomes the 78th Fibonacci retracement, a subsequent increase of up to USD 40.25 can be expected. Above, the bulls will do everything in their power to attack the all-time high. A breakout above USD 45.02 should offer further price potential towards USD 56.00 and USD 60.53. If the overall market shows its friendly side again in the coming months, a price increase up to the 161 Fibonacci extension at USD 69.98 is also conceivable. The current maximum price target for Terra is around USD 85.41. The Fibonacci 200 extension of the current trend movement runs here.
Bearish variant (Terra)
If, on the other hand, the LUNA rate falls back below the blue support area and thus also gives up the EMA50, a directional decision is made at USD 23.09. A fall below this price level would have a signal effect. Then Terra should correct into the orange support area. In addition to the breakout level of the current rally, the 38 Fibonacci retracement of the current corrective movement can also be found here. If this support zone does not hold either, the correction extends to at least USD 17.49. The green support area also represents strong support.
With the EMA200 (blue) and the MA200 (green) there are two important sliding support lines in the USD 16.00 area. Therefore, clear resistance from the buyer camp is to be expected. On the other hand, if Terra slips below this support, targets at USD 14.15 (23 Fibonacci retracement) and USD 11.77 will activate. The area around USD 11.77 represents the maximum bearish price target from the current perspective. As long as the overall market does not correct sustainably, these targets will be difficult for the bears to achieve.
Indicators (Terra)
The RSI as well as the MACD indicator show a sell signal in the daily chart. If the RSI also falls below the 45 mark, this weakness is likely to create further selling pressure, at least in the short term.
Top 10 stability
Bitcoin loses more of its value at the beginning of the week and all of its profits from the weekend are given back. In a weekly comparison, the BTC rate drops by a good three percentage points and, with the exception of the newcomer Avalanche (AVAX), pulls all top 10 Altcoins southwards. The list of losers this week is led by Terra (LUNA) with a 23 percent price decline, followed by Cardano (ADA) and Solana (SOL) with almost 20 percent price drop each. The ranking of the ten largest cryptocurrencies shows three changes in position for the past trading week. Ripple (XRP) reclaims its fifth place from Solana. In addition, Avalanche (AVAX), another blockchain ecosystem, rises to ninth place in the list of the ten largest cryptocurrencies. Terra falls one rank back to 10th place, displacing Chainlink (LINK) to eleventh place.
Winner and Loser of the Week
After a mixed performance of many top 100 altcoins in the previous week, around 80 percent of the 100 largest cryptocurrencies lose value again at the beginning of the week. The short list of winners is headed by ECOMI (OMI) with 38 percent, followed by Cosmos (ATOM) with a good 12 percentage points increase in value. Audius (AUDIO) can also grow and increase by 10 percent to the north. The long list of underperformers is led by Harmony (ONE) with a 36 percent price loss. He is followed by Arweave (AR) with a 26 percent course correction. Algorand (ALGO) and the FTX Token (FTT) also give way after a strong performance in the last few weeks of trading and lose around 25 percent of their value. In particular, the network failure of the high-speed blockchain Solana and the close interlinking with the FTX crypto exchange can be cited as a partial reason for the weakness of FTT’s share price.
Disclaimer: The price estimates presented on this page do not constitute buy or sell recommendations. They are only an assessment of the analyst.
The chart images were created using TradingView created.
USD / EUR exchange rate at the time of going to press: 0.85 euros.