
Bitcoin Dominance Rate (BTCD) is looking to find a support zone following a short-term rejection by a Fibonacci resistance level.
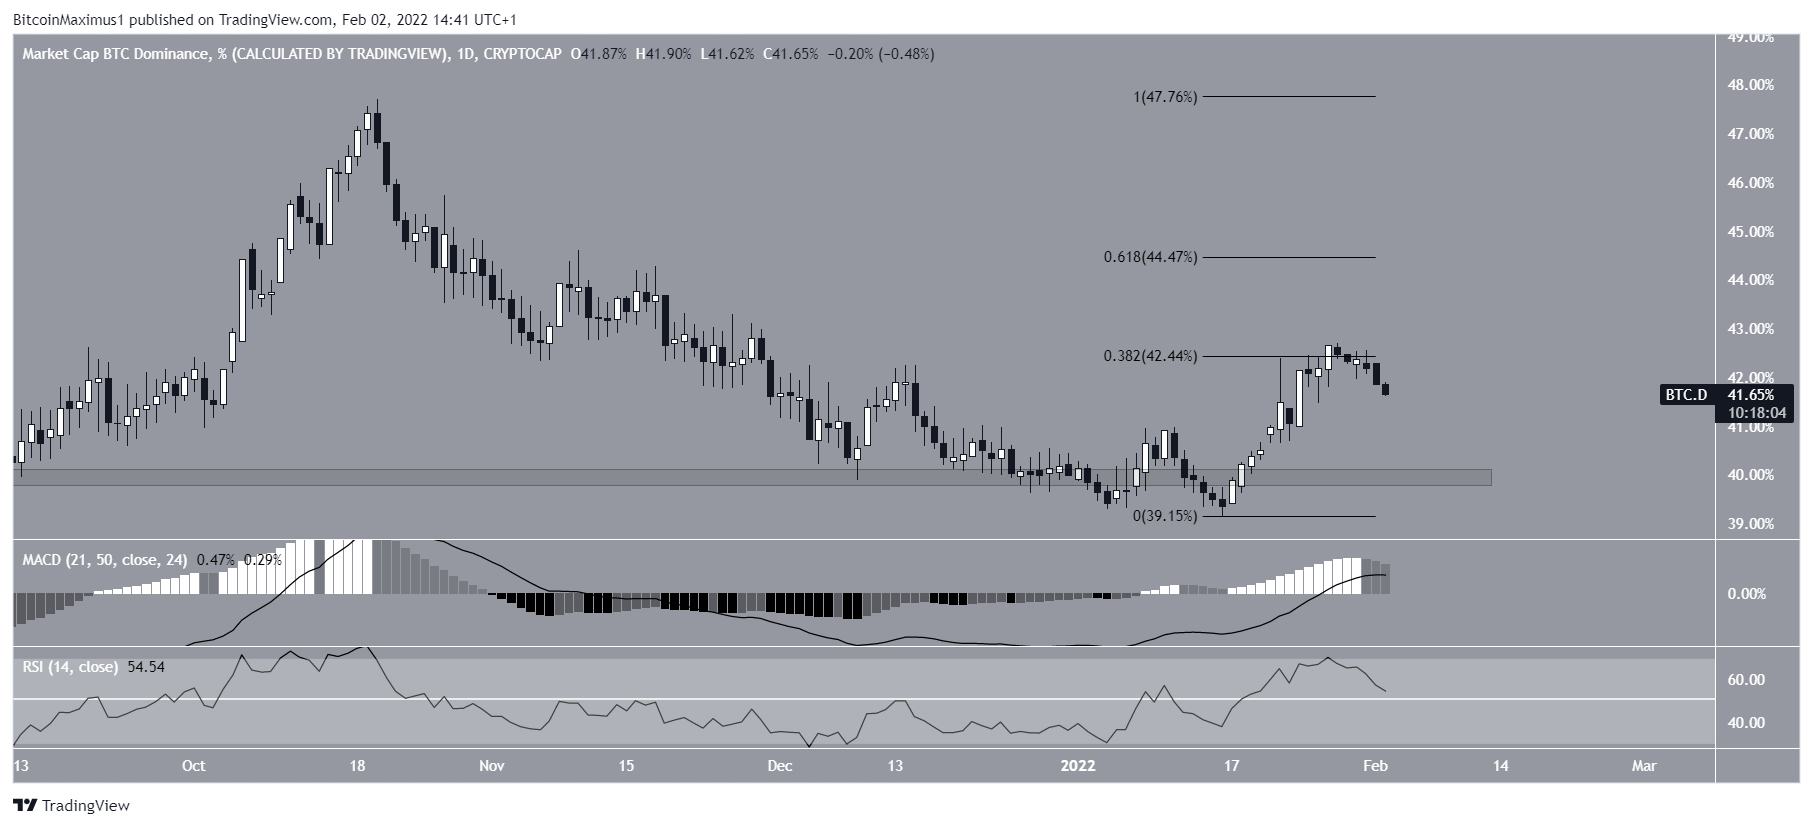
BTCD had been trading above the 40% horizontal support zone since May 2021. This zone has been the catalyst for several bullish moves.
However, the rate appeared to drop below this zone on January 2, 2022 (red circles). Despite this decline, it then managed to regain this area shortly after and then moved upwards.
These kinds of deviations are considered bullish developments and often lead to significant future increases.
BTCD’s Ongoing Rebound
The crypto trader @Axeloncrypto shared a chart of BTCD on Twitter, saying he expects the current resistance at 42.5% to reject the rate.
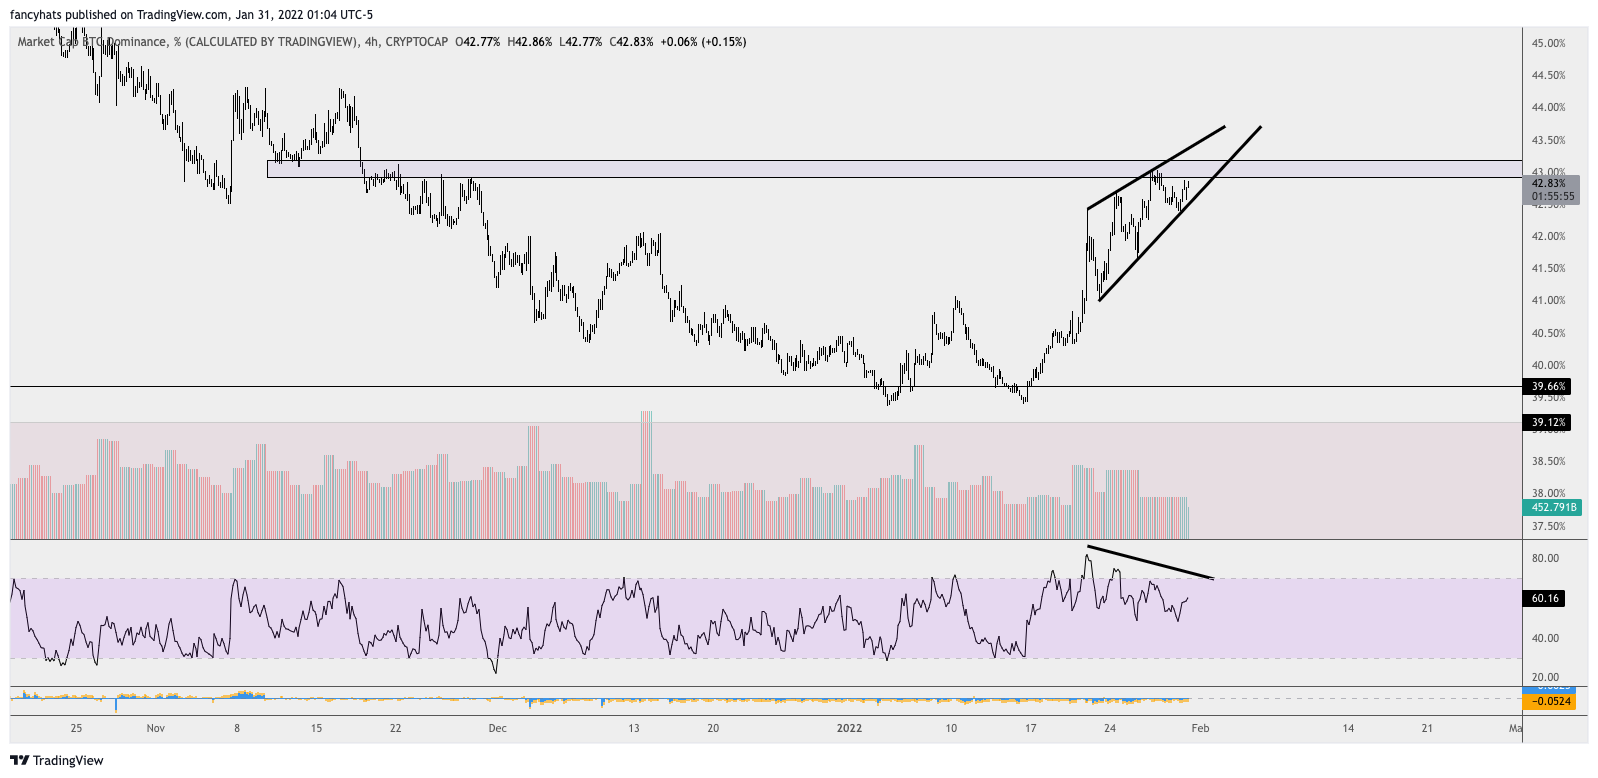
Since this tweet, Bitcoin’s dominance rate has been rejected by this resistance and has fallen. The 42.5% resistance area also matches the 0.382 Fibonacci retracement resistance level, which makes it all the more important.
Despite this rejection, the technical indicators are still bullish. Indeed, the MACD is positive and the RSI is above 50.
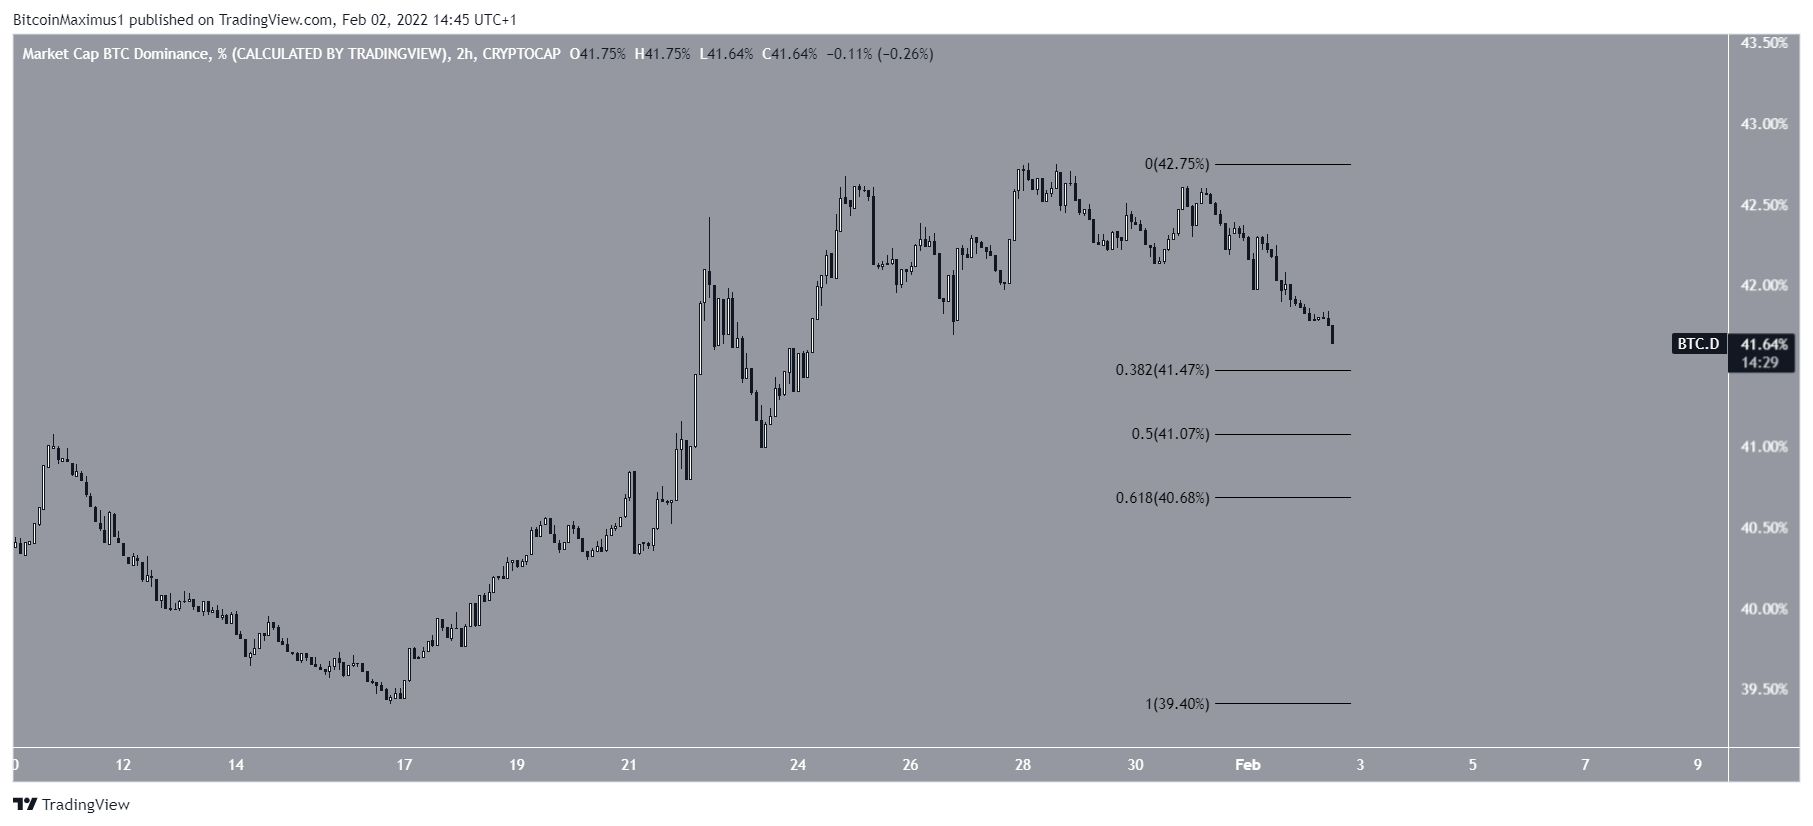
The two-hour chart suggests that the main support levels are found at 41.5%, 41% and 40.5%. These are the respective Fibonacci retracement levels 0.382, 0.5 and 0.618.
Should the bullish move continue, BTCD should bottom out above either of these levels.
Long term structure
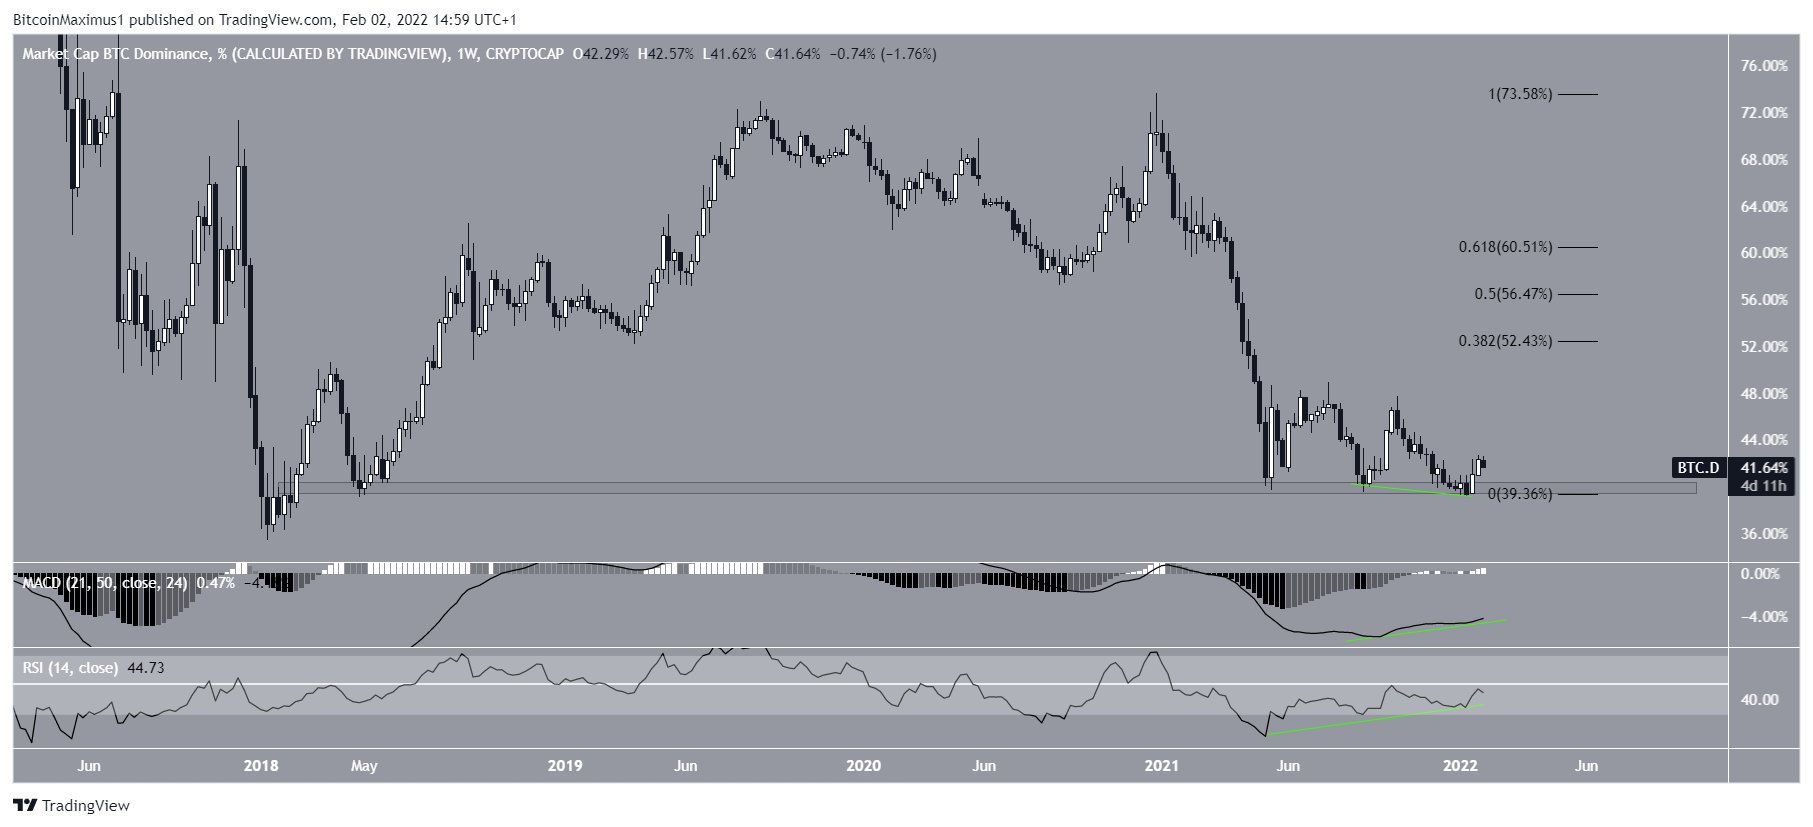
The weekly chart presents a bullish outlook for BTCD. This is especially seen thanks to the considerable bullish divergence that has developed in both the RSI and the MACD (green lines). These divergences very often precede significant upward movements. The fact that the divergence is present in the weekly data only increases its importance.
Within the weekly data, the main resistance levels are located at 52.5%, 56.5% and 60.5%.
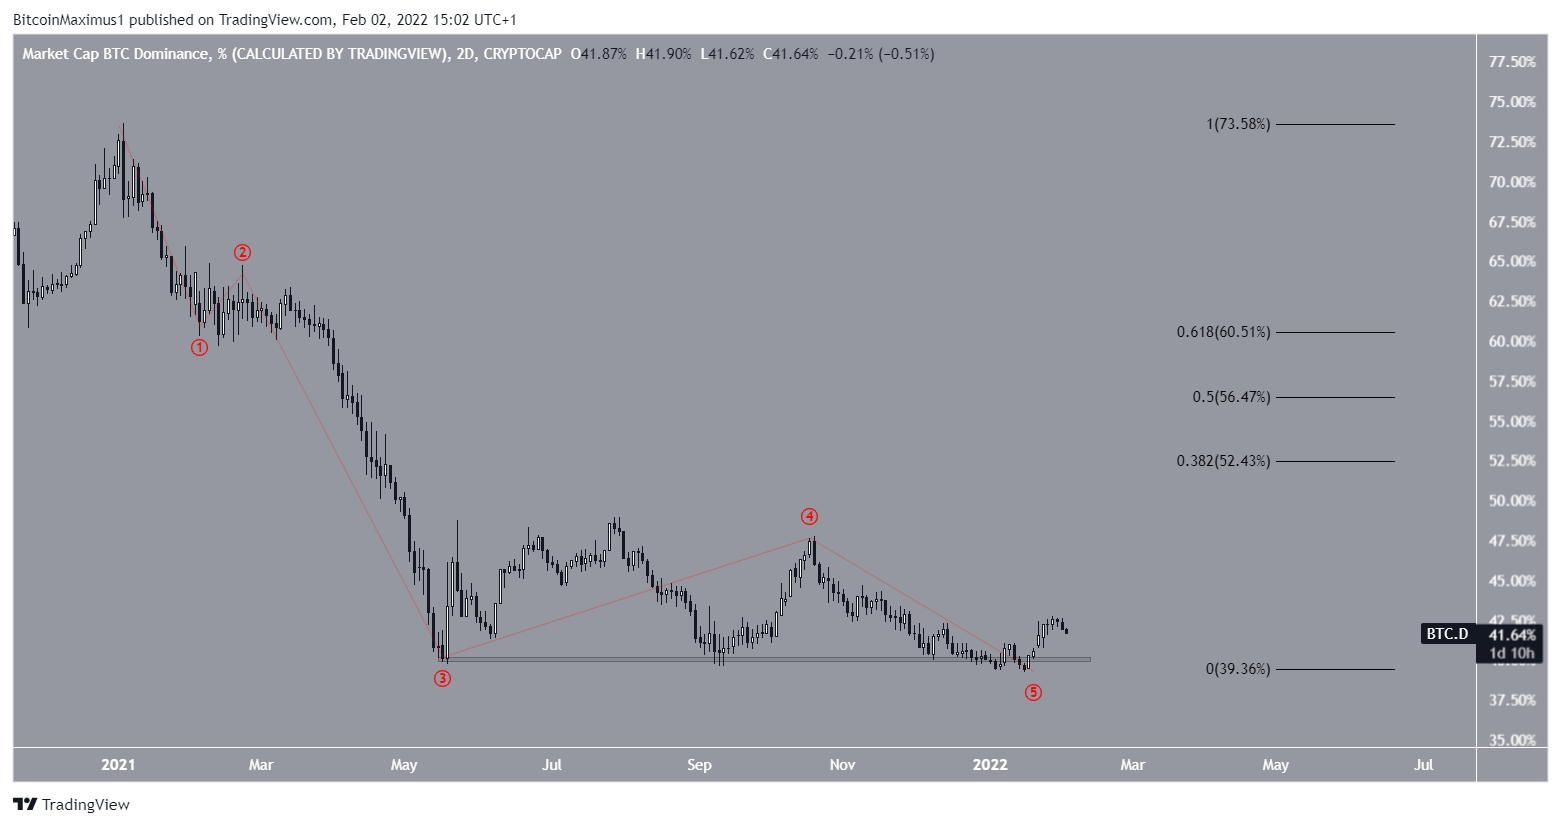
The wave count since December 2021 also supports this possibility, as it points to a full five-wave bearish pattern.
It is therefore possible that BTCD has already reached a long-term low.
Disclaimer
All information on our website is published in good faith and for general information purposes only. Any action taken by the reader based on information found on our website is entirely at their own risk.