- Course (LINK): $7.71 (previous week: $7.03)
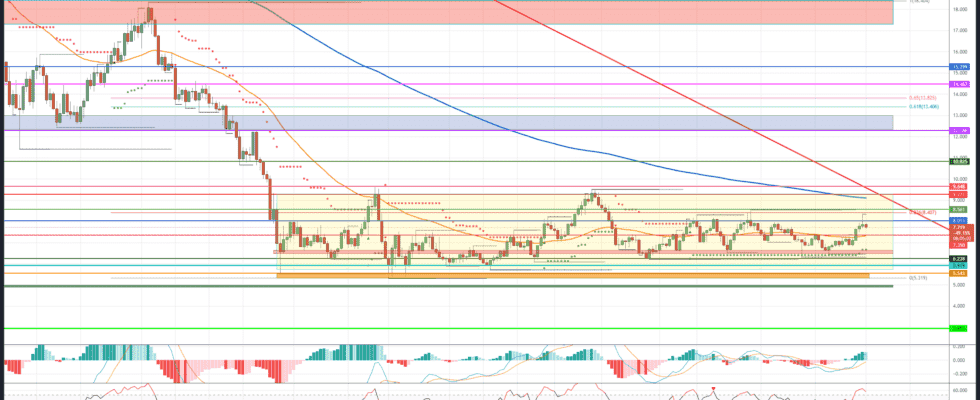
- Resistances/Goals: $8.01, $8.40/8.56, $9.27/9.64, $10.83, $12.36, $13.40/13.82, $14.47, $15.30 USD
- Supports: $7.35, $6.60, $6.23, $5.91, $5.54, $5.30, $4.90, $2.95
Chainlink Recap
- Chainlink price may rally in double digits in value over the past 7 days, rallying to the resistance at $8.01 at the start of the week.
- According to Chainlink co-founder Sergey Nazarov, a recent significant increase in transaction activity in the link network, with 13 transfers of more than 1 million US dollars, caused a noticeable price recovery last weekend.
- The important support area at USD 6.60 has repeatedly functioned as a good support level in the last two trading months.
- In addition to the staking option announced for the coming month of December, interest in the largest data oracle in the blockchain space currently seems to be gaining momentum.
- Further upgrades such as the forthcoming cross-chain interoperability of the Chainlink network should also boost the LINK price in the coming trading months.
The development in the last seven days
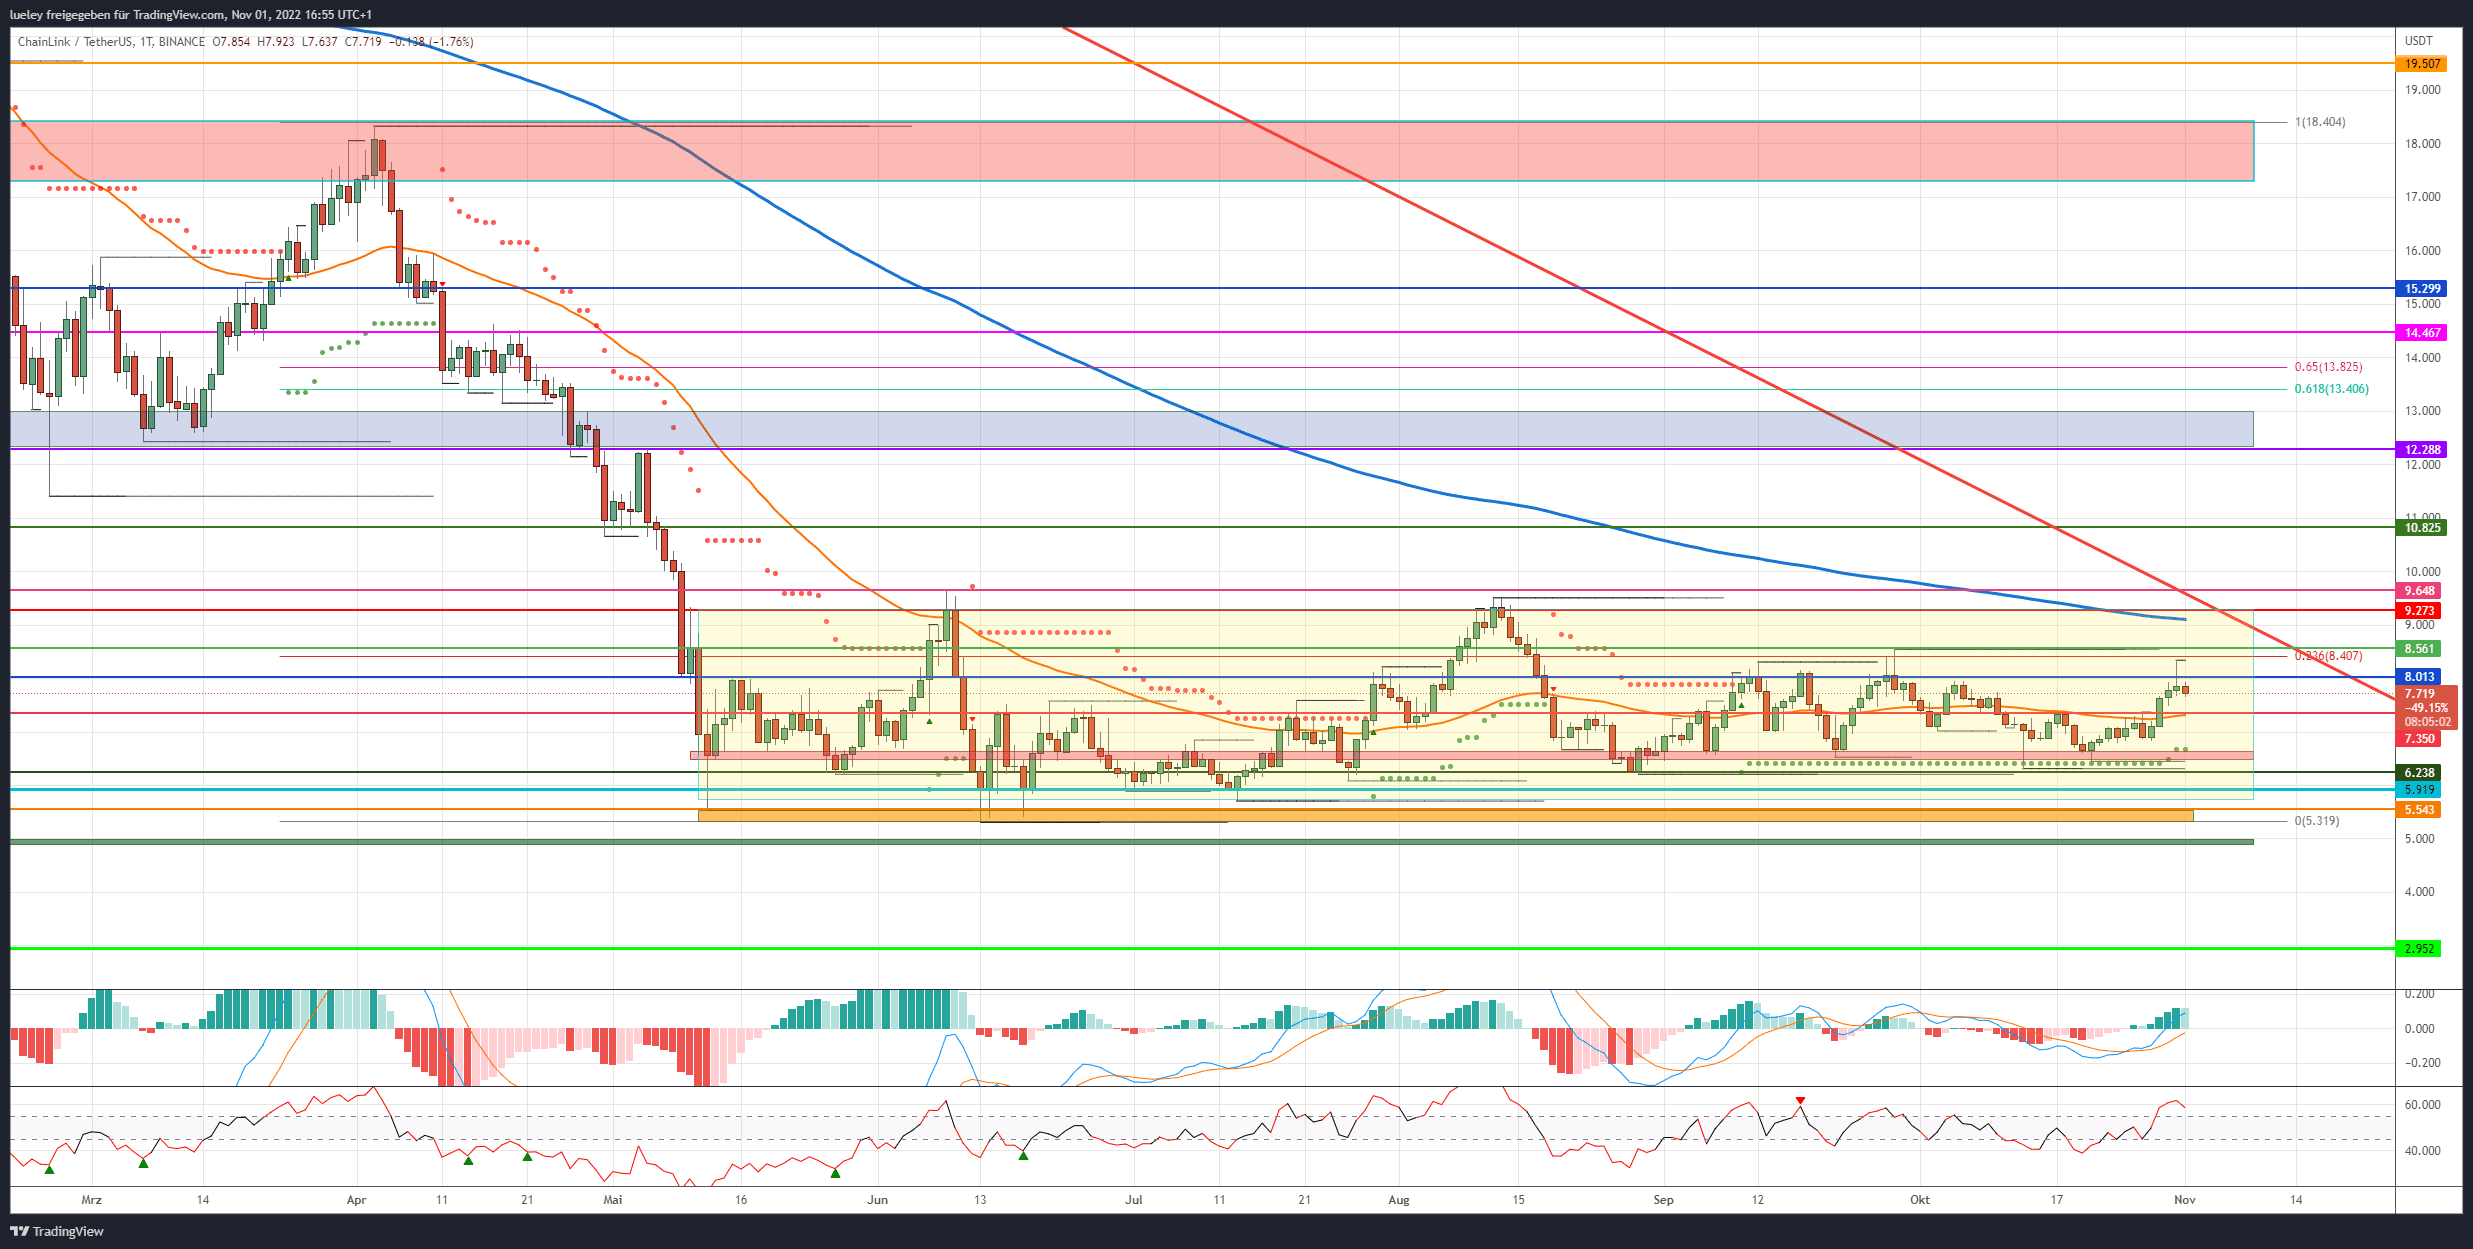
- Despite these key improvements, Chainlink has yet to recapture the 23 Fibonacci retracement at $8.40 since the last price analysis on September 29th. Chainlink has been wedged in a sideways range between USD 5.91 and USD 9.27 since May 12th.
- A price breakout of this trading range should result in an explosive price movement.
- Recently, however, the LINK price had been able to form higher lows again and, if it stabilizes above USD 8.01, it should quickly rise towards the upper edge of the yellow range.
- The indicators also show buy signals in the daily chart. The RSI indicator as well as the MACD also have room to go up.
- The positive chart picture only clouded over more sustainably when the daily close was below USD 5.91.
Bullish Variant (Chainlink)
- LINK price attempted another breakout above the strong resistance at $8.01 yesterday Monday 31st October. However, in the course of a price consolidation for Bitcoin (BTC), Chainlink had to give up at short notice.
- If Chainlink picks up momentum again in the coming days and breaks through the USD 8.01 mark at the daily closing price, a subsequent increase in the direction of the zone around the 23 Fibonacci retracement between USD 8.40 and USD 8.56 should be planned. If the LINK price also overcomes this resist area, a preliminary decision at the upper edge of the trend channel between USD 9.27 and USD 9.64 can be expected. At this multiple resistance area of the EMA200 (blue) and the major downtrend line, the bulls must combine all their strengths to break through this high buying volume zone.
- If a dynamic breakout above this cross-resistance is successful and Chainlink can stabilize above it, the area around USD 10.82 automatically moves into the focus of investors. This would also brighten the chart picture in favor of the buyer camp.
Higher targets firmly in sight
- If this resistance is also pulverized as a result, a march through to USD 12.28 can be expected.
- The resistance area between USD 12.28 and USD 13.00 has acted as resistance several times in the past, which is why the buyer side is likely to fail in the first attempt. Therefore, this zone represents the first medium-term price target.
- If Chainlink can then establish itself above USD 13.00, the upward movement in the direction of the Golden Pocket expands between USD 13.40 and USD 13.82. Again, investors should realize profits here.
- If the buyer side succeeds in recapturing this important resist area in the long term, the next superordinate target zone between USD 14.47 and USD 15.30 will be activated. In addition to the lows from May and June of the previous year 2021, this zone also acted as an important support area at the beginning of 2022 before the strong sell-off in April of this year. Therefore, further profit-taking by the bulls should be planned in this massive resist zone.
- An increase back to the long-term price target in the area of the red resistance zone between USD 17.29 and USD 18.10 is only conceivable if the overall market can also move back north in the long term. Here are the historical highs from February and April of this year.
- In particular, the upper edge at USD 18.10 should be given more attention. The 38 Fibonacci retracement of the complete downward trend movement also runs here. A break above this resistance is likely to provide further upside momentum for LINK price. From the current perspective, however, a recapture of this price mark is not to be expected in the coming weeks and months.
Bearish Variant (Chainlink)
- The bears have been able to parry the breakout above USD 8.01 again in the last 24 hours of trading. The LINK course is trending back south again this Tuesday, November 1st, and could soon correct again to USD 7.35. This support level from the horizontal support line and EMA50 (orange) should offer solid price support in the short term.
- If the seller can sustainably push the Chainlink price below the EMA50 running here, this would again be a first indication of weakness.
- The bears should then do everything in their power to sell the LINK price back to the red support area at USD 6.65. In addition to the lows of the last 2 trading months, the super trend can also be found in the daily chart. A price rebound should therefore be planned for when making initial contact.
Timely preliminary decision expected
- If the key cryptocurrency Bitcoin (BTC) is taken in kinship with the Nasdaq in the course of new interest rate hikes by the US Federal Reserve and corrects back below USD 19,881 towards USD 19,000, Chainlink should also fall further and if the 6.23 USD losing footing again.
- At USD 5.91 there is then a directional decision on the underside. If the bears succeed in sustainably breaking through this strong support, and the support at USD 5.54 subsequently breaks through, the focus will shift back to the low for the year at USD 5.30.
- If there is no significant price reversal to the north, and Chainlink falls below the yearly low at the daily closing price, the correction movement should extend immediately to the breakout level from June 2020 at USD 4.90.
- For the time being, this price level represents the maximum price target on the underside. Only when Bitcoin also gives way to a new annual low and corrects towards USD 16,180 can Chainlink also fall back to USD 2.95.
Disclaimer: The price estimates presented on this page do not represent buy or sell recommendations. They are merely an assessment by the analyst.
The chart images were created using TradingView created.
USD/EUR exchange rate at the time of going to press: EUR 1.01.
Do you want to buy cryptocurrencies?
Trade the most popular cryptocurrencies like Bitcoin and Ethereum as an ETP on Scalable Capital, the leading investment platform in Europe.