Synthesis
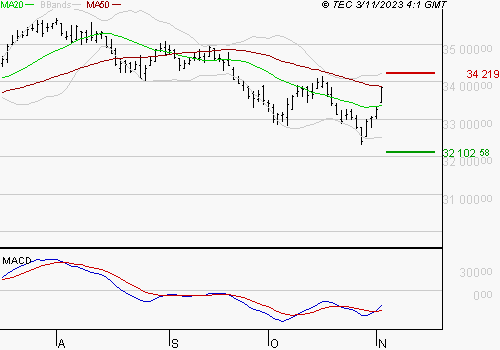
The MACD is negative, but it is above its signal line: the trend is changing. Now, the MACD must cross zero for the rise to continue in the coming days. The RSI is above 50, this confirms a good direction of the index. Stochastic indicators do not give clear signals for the days to come. The volumes traded are lower than the average volume over the last 10 days.
Moves and Levels
Since the lowest at 32417.59 PTS, the index is in the technical recovery phase towards its 50-day moving average located at 33879.83: the behavior of prices at this level will make it possible to envisage the continuation of the movement in the medium term. To lighten the position, we can wait to test the short-term resistances located at 34219.75 PTS and 35066.62 PTS. Supports are at 32102.58 PTS then at 31679.15 PTS
| Tendency | Calculated data | ||
|---|---|---|---|
| Technical advice | Neutral | Course on 03/11 | 33,839.08 |
| Basic trend | Bearish | MM20 | 33,372.88 |
| Bracket 1 | 32,102.58 | MM50 | 33,879.83 |
| Bracket 2 | 31,679.15 | ROI | 56.37 |
| Resistance 1 | 34,219.75 | MACD | – 190.16 |
| Resistance 2 | 35,066.62 | Stochastic | 58.32 |
Technical analysis provided by © TEC
Technical Analysis provided by TEC ©2023. All rights of reproduction and representation reserved. TEC is an analysis of the technical situation of an asset at a given time and which is subject to change at any time. The notions of support and resistance come from the elementary principles of technical analysis. This indicative information does not in any way constitute an inducement to sell or buy. The reader remains solely responsible for their interpretation and use of the information made available to them.
