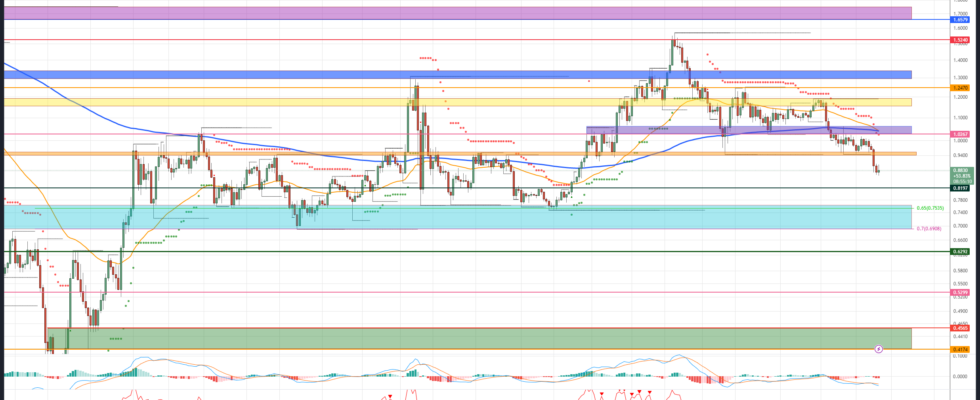
The course of the Ethereum Layer 2 project Polygon (MATIC) recently corrected significantly. As stated in the last MATIC price analysis on April 6th, a directional decision was looming, which the bears have been able to win in the last few weeks. Along with Polygon, the Layer 2 competitors Arbitrum (ARB) and Optimism (OP) have also corrected significantly to the south since mid-April. At the beginning of the week, the MATIC course broke through the strong support level at 0.95 US dollars, which acted as a reversal level several times in the previous months. If the bulls fail to recapture this level in a timely manner, the current correction is likely to widen towards the Jan 8 surge rally breakout level of $0.82.
Polygon: The bullish price targets
Bullish price targets: 0.95 US$, US$1.02, US$1.15/1.19, 1.25 USD, 1.33 USD, 1.52 USD, 1.65/1.75 U.SD
Polygon failed to reclaim the yellow resistance area around $1.15 multiple times in the previous month. As a result, the MATIC course came under significant pressure and recently broke through the massive support zone at 0.95 US dollars. In order to end the current price slide, the MATIC price must quickly regain this broken price level. Only if the bulls manage a dynamic jump back above this level, a recovery move back towards $1.02 is conceivable.
This is where a final directional decision is made for the coming weeks. In addition to the horizontal resistance, the moving average lines EMA200 (blue) and EMA50 (orange) as well as the supertrend in the daily chart can also be found here. Only if the Bitcoin (BTC) price can stabilize back above the $29,200 mark and march towards $30,000 would a breakout of this resist be conceivable.
The recovery could then take shape and take MATIC back towards the April high of $1.19 in the medium term. If the yellow resistance zone is recaptured in the future, the Polygon price should rise above the March high of $1.25 and into the blue zone of $1.33. Here is to plan with increased profit-taking.
If, contrary to expectations, the bulls manage to stabilize above the blue resist zone, a renewed attempt towards the high for the year is conceivable. The $1.52 area represents the maximum price target on the upside for now.
MATIC course: The bearish price targets
Bearish price targets: $0.82, 0.75/0.69 US$, US$0.63, US$0.53, 0.45/0.41 USD
As suspected in the last price analysis, the bears had to push Polygon below the purple support area and thus below the EMA200. The seller side was also able to win the mentioned medium-term directional decision at USD 0.95. Currently, Polygon appears to be on a direct path towards $0.82.
This makes a retest of the turquoise support area increasingly likely. In addition to the annual low of January 1st, the parent Golden Pocket can also be found in the zone between USD 0.75 and USD 0.69. For the time being, this zone represents the maximum bearish price target. The probability of a new long entry by the bulls is to be rated as high in this area.
If the overall crypto market also falls more significantly and MATIC price slides below this strong support area, the July 16, 2022 breakout level of $0.63 will come into focus. This would also further increase the chance that Polygon could even drop towards $0.52 in the medium term. The maximum overriding bearish price target in the green support zone between US$ 0.45 and US$ 0.41 could then no longer be completely ruled out.
Looking at the indicators
The RSI indicator is now clearly oversold at the 30 level. A temporary recovery movement is therefore conceivable. However, since the MACD has also formed a new sell-signal and is moving more clearly below the 0-line, it shows that the bears are firmly in control.
Also in the weekly chart, the RSI has slipped below the neutral zone and has thus generated an overriding sell-signal. The MACD indicator is also showing a short signal and should cause further selling pressure if it falls below the 0 line.
Disclaimer: The price estimates presented on this page do not represent buy or sell recommendations. They are merely an assessment by the analyst.
The chart images were created using TradingView created.
USD/EUR exchange rate at the time of going to press: EUR 0.92.
Do you want to buy cryptocurrencies?
Trade the most popular cryptocurrencies like Bitcoin and Ethereum on eToro, the world’s leading social trading platform (81% of retail CFD investors lose money).
The latest issues of BTC-ECHO Magazine
You might also be interested in this