
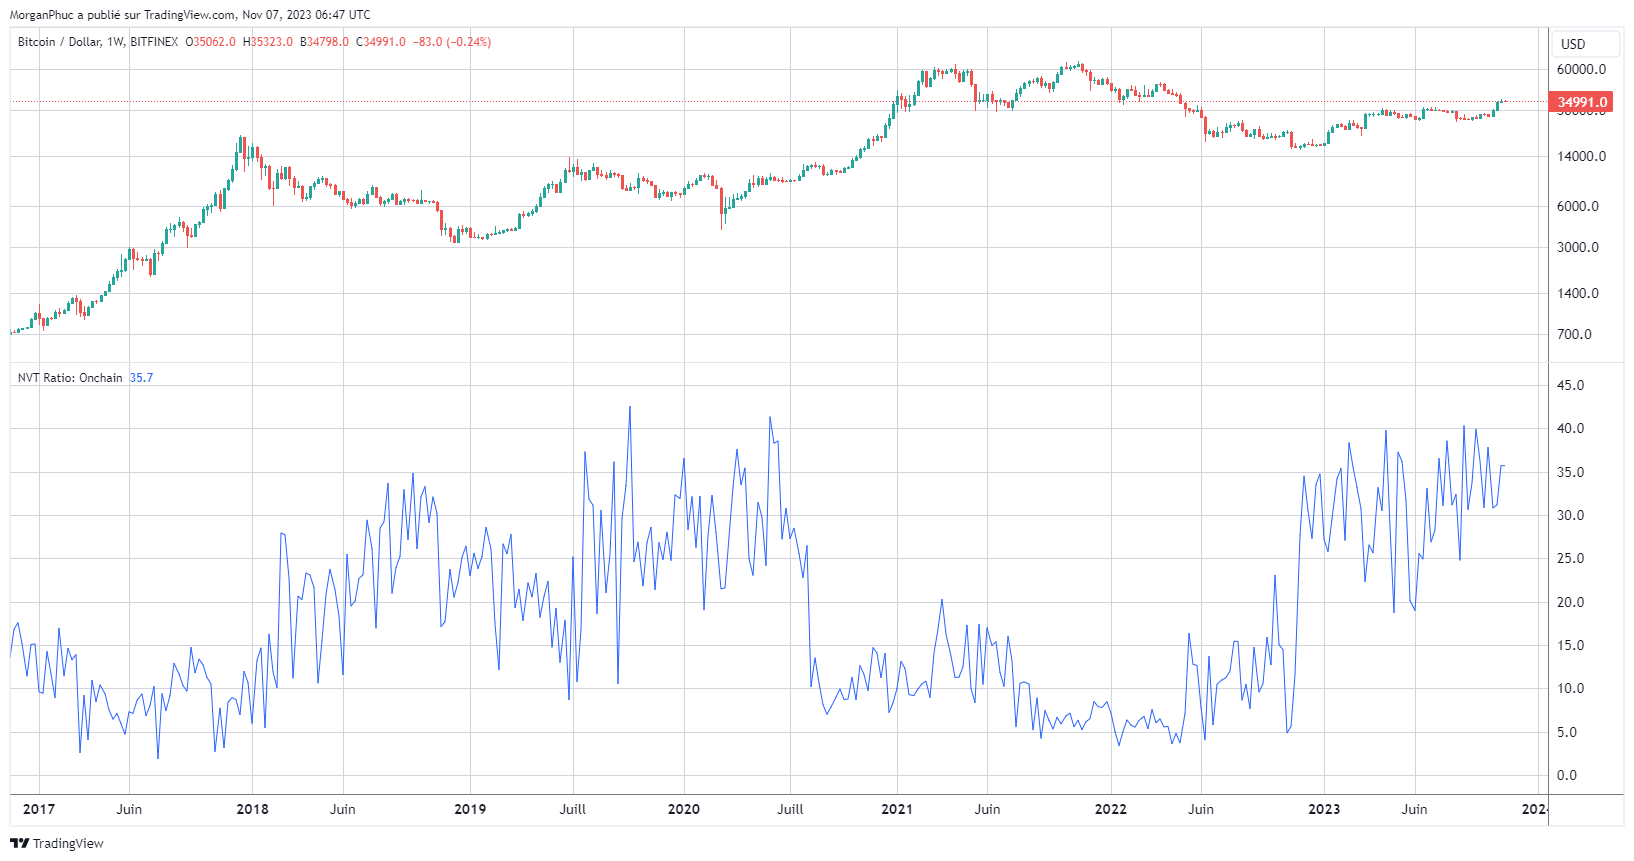
There are many on-chain indicators For Bitcoinderiving from data collected by studying the activity of its blockchain. In this article we will study the NVT (Network Value to Transactions) Ratio. This indicator is based on the relationship between the market capitalization of bitcoin and the transfer volumes on its blockchain.
What is Bitcoin’s NVT Ratio?
THE Network Value to Transactions Or NVT Ratio is an indicator for Bitcoin developed by Willy Woo. This trader is well known in the cryptosphere for basing his strategies on fundamental analysis and the study of data on-chain. Unlike technical analysts who rely on the study of variations in the price of bitcoin, fundamental analysts study the Bitcoin blockchain in depth to detect other types of information.
The NVT Ratio relates the market capitalisation (market cap) of Bitcoin and the volume of on-chain transactions. It is similar to PE Ratio (Price-to-Earnings) traditional financial markets.
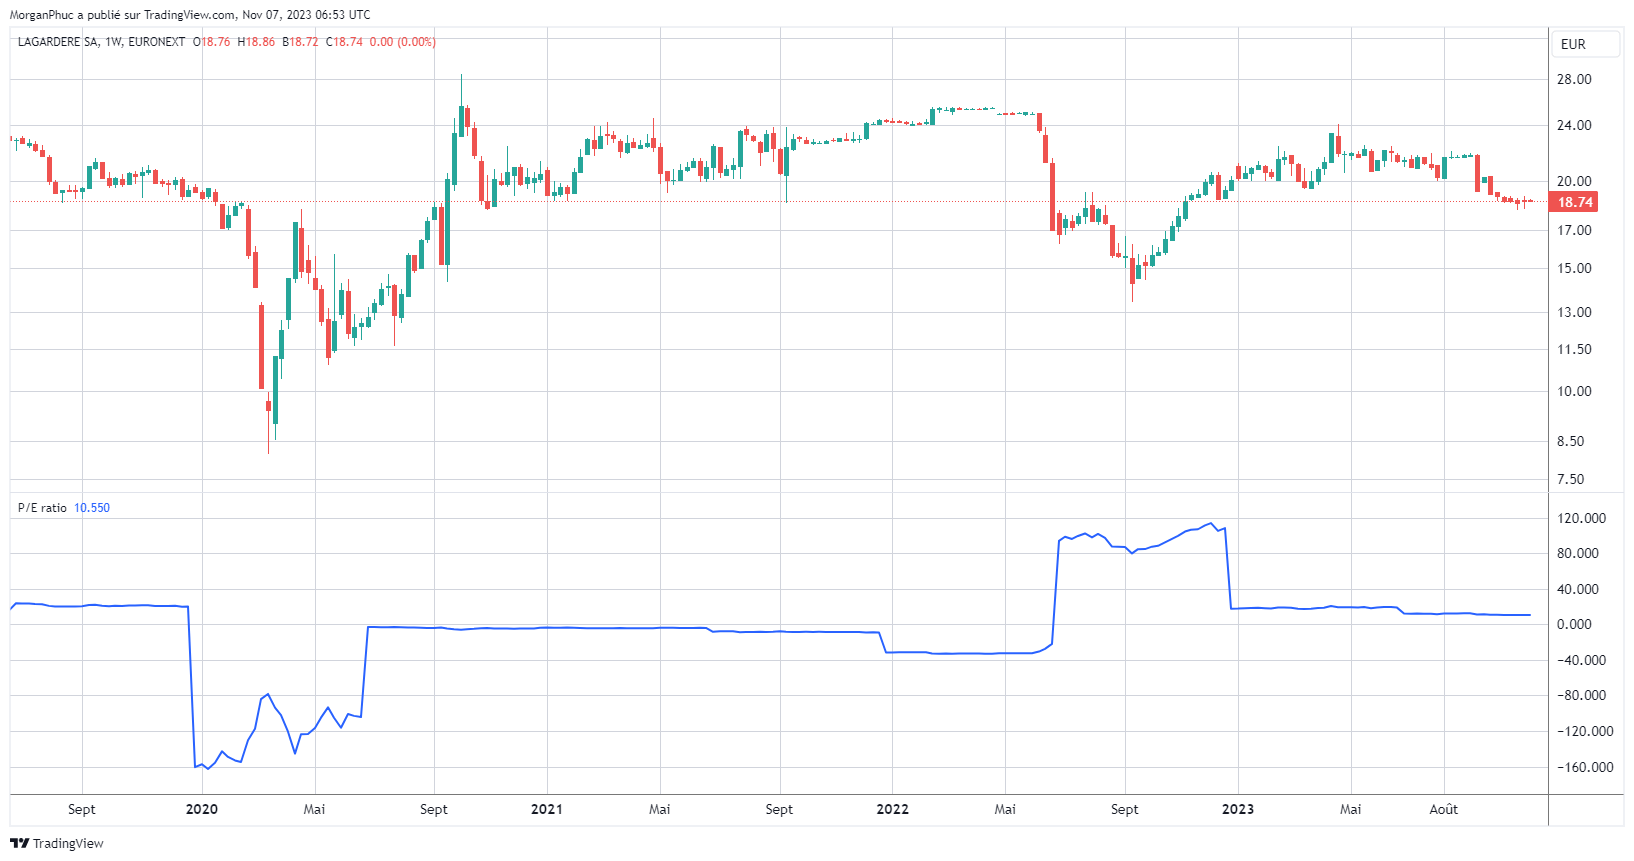
The Price-to-Earnings Ratio (P/E) on equity markets
THE P/E is the indicator most used by investors in the stock market to determine the value of a stock. It is based on the comparison between the Market value of an action and the profits (earnings) of the corresponding company. P/E is calculated by dividing the price of a share by the last income it produced – the dividends the stock would provide if the company’s net income were paid to shareholders.
Without going into details, it allows you to judge whether an action is overvalued Or undervalued. When the P/E is high, the stock price is high relative to the profits the company makes. The analyst therefore considers that the stock is overvalued. When the P/E is low, its price is low relative to the financial activity of the company. We will therefore consider that the stock is undervalued.
Bitcoin does not grant dividends to its holders, so another metric must be used to find an equivalent indicator.
General idea and calculation of NVT Ratio
In order to find the P/E equivalence for an asset such as BitcoinWilly Woo is based on 2 of the value propositions of the network:
- Storage of value : it is the market capitalization (market cap) which serves as a measure. The market cap or market value is obtained by multiplying the current price of a BTC by the number of BTC in circulation on the market.
- The transfer of value : Bitcoin is a global and decentralized payment network. Its usefulness can be measured by taking into account the trading volume carried out on its blockchain.
Since the creation of Bitcoin, its market capitalization has logically grown with its use. The NVT Ratio is then used to detect changes in the BTC price trend.
The two measurements are related to obtain a ratio which defines a general feeling of the market. Concretely, the NVT Ratio is calculated as follows:
NVT Ratio = Market capitalization / Trading volume (in dollars)
This ratio therefore measures the relationship between value And utility of the network. It is then interpreted to determine whether or not there is a balance between the two.
General interpretation
The NVT ratio is interpreted according to 3 scenarios:
- NVT Ratio high or in upward trend: market capitalization exceeds transaction volume. This means that investors are overvaluing Bitcoin relative to its actual usage. This is therefore a sign of an imminent market top and an overbought BTC.
- NVT Constant/lateralizing ratio: market cap and transaction volume are balanced. This is a sign of good market health. Generally, this is the case at the start of a cycle, whether bullish or bearish. This means that the direction taken is tenable. The NVT ratio will then move in one direction once the cycle is in full swing.
- NVT Ratio low or in downward trend: Bitcoin usage is high relative to its price value. Investors are undervaluing Bitcoin relative to its usage. This therefore indicates a near market bottom, and BTC in an oversold zone.
Of course, the NVT ratio does not give no real guarantee. The valuation of bitcoin and the use of the network have changed over time. Bitcoin can be used for a certain period of time as a means of payment, then the overall narrative changes. For example, in its early days, Bitcoin was used extensively in Internet black markets (the Silk Road era). A few years later, it was presented as digital gold to new investors.
It is therefore important to take into account the values of the NVT Ratio for similar market cycles in terms of adoption and vision.
Refine the reading of the NVT Ratio
Analysts will generally use a moving average of the NVT Ratio in order to have a more global vision. Indeed, its value can vary greatly within the same day. Moving averages over a month or several weeks are preferred to provide a tendency clearer.
The NVT Ratio is a complex indicator to use. It is therefore necessary to take into account other analysis tools to confirm its interpretation.
NVT Ratio high in uptrend
Generally speaking, when the NVT Ratio East pupil and that the price of BTC is bullishthe signal is bearish (bearish). Investors buy bitcoin at a price that does not reflect its value as a payment system. We are talking about premium or overvaluation : the price is decorrelated from the overall utility of the network. If other indicators suggest that the price is overbought, it may be time to take profits.
Be careful though, in the world of cryptocurrencies, which is booming, bullish phases can be spectacular. The NVT Ratio can grow for long periods of time. The price of bitcoin has experienced numerous cycles where its growth was exponential. We cannot say that a high NVT Ratio is synonymous with a market in bubble. On the other hand, after a higher high (market top), it makes it possible to differentiate a phase of correction and of consolidation of a major crash.
Indeed, phases of euphoria lead many network users to carry out a considerable amount of transactions. When the euphoria subsides, the price can correct, and enter a phase of consolidation. If the NVT ratio remains very high, this means that the transaction volume decreases sharply. This is a sign that the utility of the network is no longer correlated to the high price of its unit of account. An NVT Ratio remaining abnormally high during a consolidation phase in an upward trend is therefore a bearish signal. This portends a substantial correction or crash.
NVT Neutral Ratio
On the other hand, if the NVT Ratio remains within a “normal” range, this means that strong transactional activity supports the high valuation of bitcoin. This is the signal that the market is not yet in full bubble, and that there is still room before reaching a top of cycle.
NVT Low ratio in downtrend
The NVT Ratio is a good indicator for detecting sill and the purchasing opportunities. Other indicators must also be taken into account to refine your reading.
When the NVT Ratio is weak and the price is downtrend clear (bear market), this means that the price of bitcoin does not reflect on-chain activity. New users appear on the network, but the price does not change its trend. This may signal a undervaluation of Bitcoin and a bullish movement to come.
NVT Signal and NVT/HV
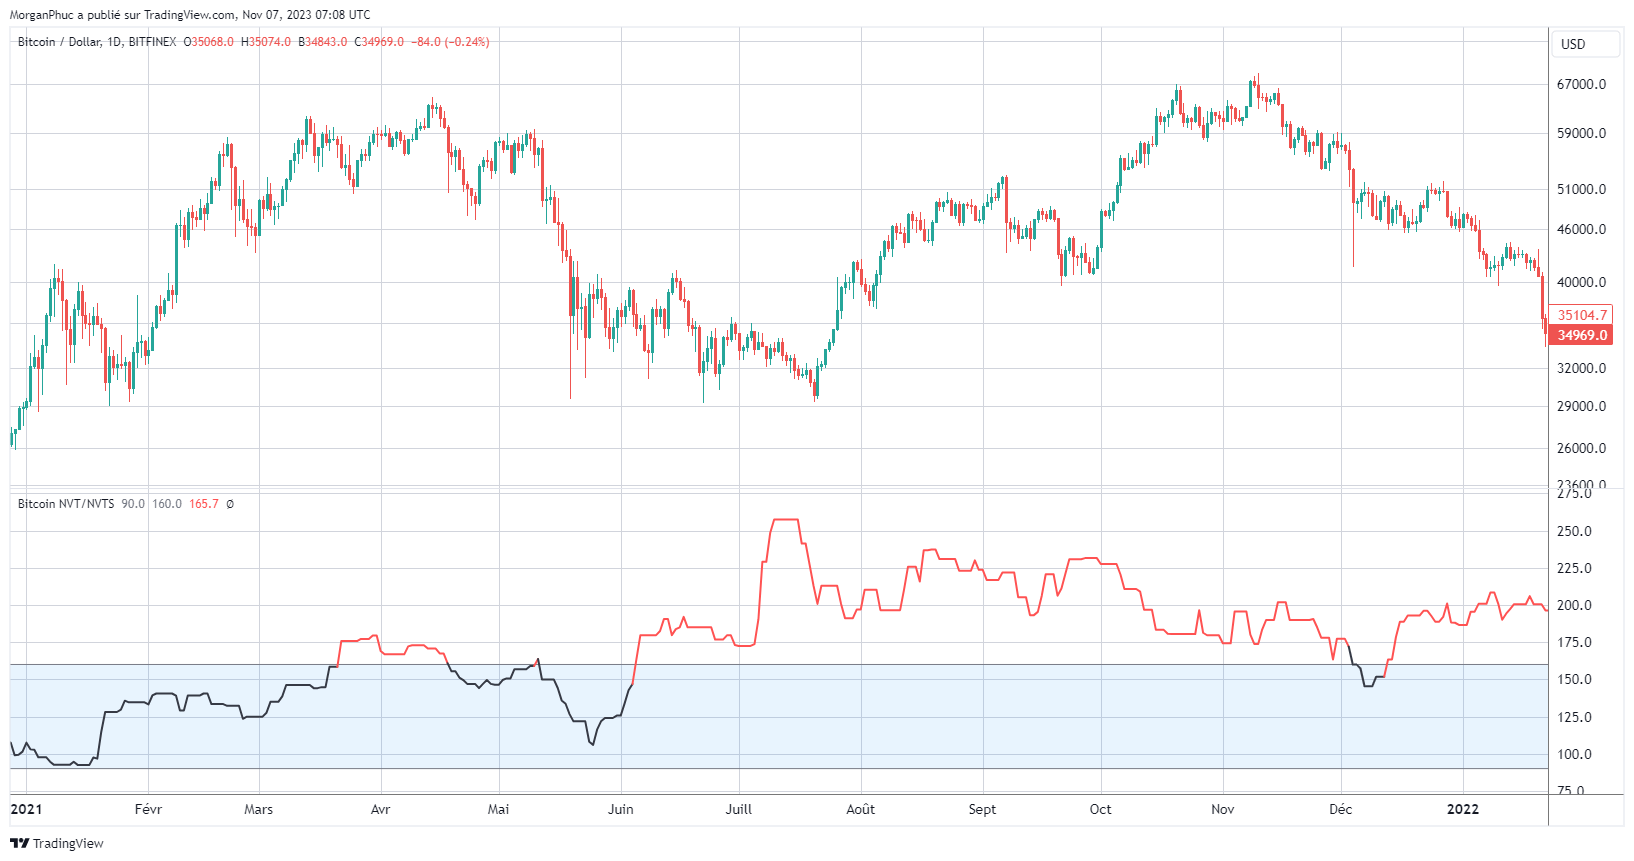
THE NVT Signal (NVTS) is a modified version of the NVT Ratio where the gross daily trading volume is replaced by its 90-day moving average. It was defined this way to more easily predict market highs. Indeed, peaks and troughs will be much more sensitive, signaling market highs with more precision.
However, the presence of many bitcoins off-chain reduces the effectiveness of this indicator. In general, it is not its absolute value which will be taken into account, but the trend changes. The analysts will thus trace support lines and of resistanceand wait for a breakout to take the signal into account.
The NVT Ratio can also be coupled with other indicators, such as historical volatility of Bitcoin. We then obtain the NVT/HV. Low volatility generally indicates a big market move ahead.
Indicator reliability
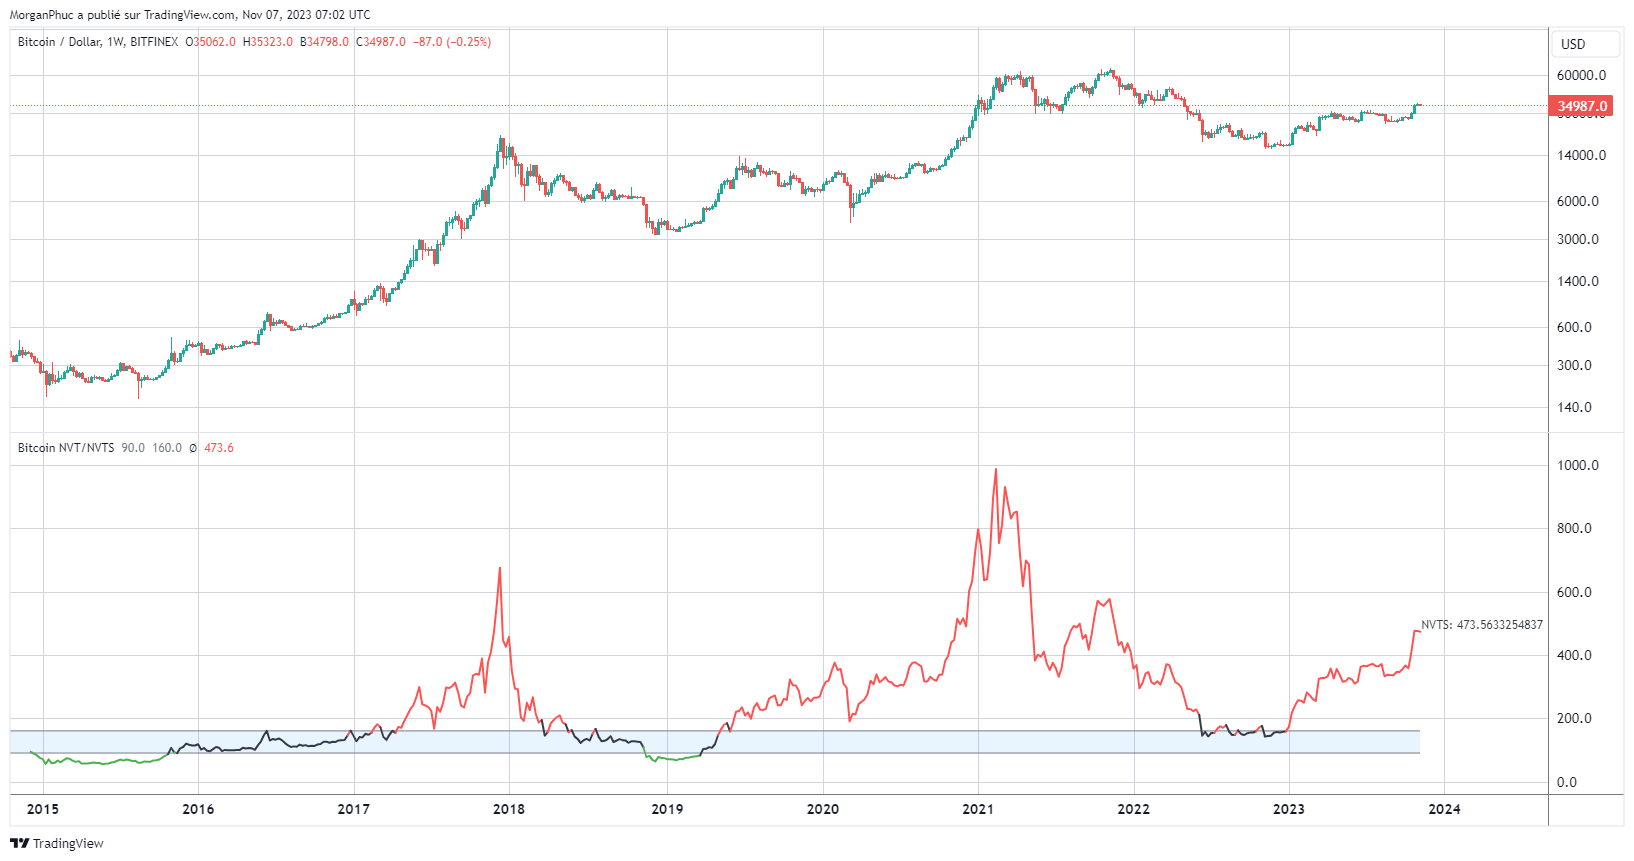
Like all indicators, the NVT Ratio should not be used alone. It is by adding together the indications and signals that we can refine our analysis. However, NVT has historically given valuable signals when the Bitcoin market was in decline. overheated. Likewise, the NVT Signal was relatively accurate when it came to identifying sill previous cycles.
Take for example the period 2013-2014 where we witnessed 3 successive bull markets. Coupled with support lines, the NVTS made it possible to identify market highs.
It is commonly accepted that the area of 150 is synonymous with overboughtand the area of 45 of overselling. In 2017the NVTS broke its resistance line at each new low during this historic bull run.
If you are interested in on-chain indicators, do not hesitate to take a look at the following articles:
If you feel like an analyst, don’t hesitate to support our work by using our affiliate link for Glassnode Studio, the best on-chain analysis tool on the market!