After several days of sideways consolidation, the Bitcoin price can stabilize above the cross-support from EMA20 and MA200 and recapture the 50,000 mark. How it could go on now.
BTC course: 50,122 USD (previous week: 47,884 USD)
Resistance / goals: $ 50,325, $ 51,307, $ 53,005, $ 54,077, $ 55,817, $ 57,998, $ 59,470, $ 61,771, $ 64,896, $ 67,416, $ 69,660, $ 70,856, $ 76,472, $ 77,678
Supports: $ 48,222, $ 47,070, $ 46,009, $ 44,878, $ 44,147, $ 42,923, $ 41,321, $ 40,585, $ 39,240, $ 38,537, $ 37,321, $ 36,643, $ 34,899, $ 33,335, $ 32,718, $ 31,603, $ 31,010 , $ 30,000, $ 29,300, $ 28,795, $ 27,563, $ 26,404, $ 23,887, $ 22,222, $ 21,892, $ 19,884,
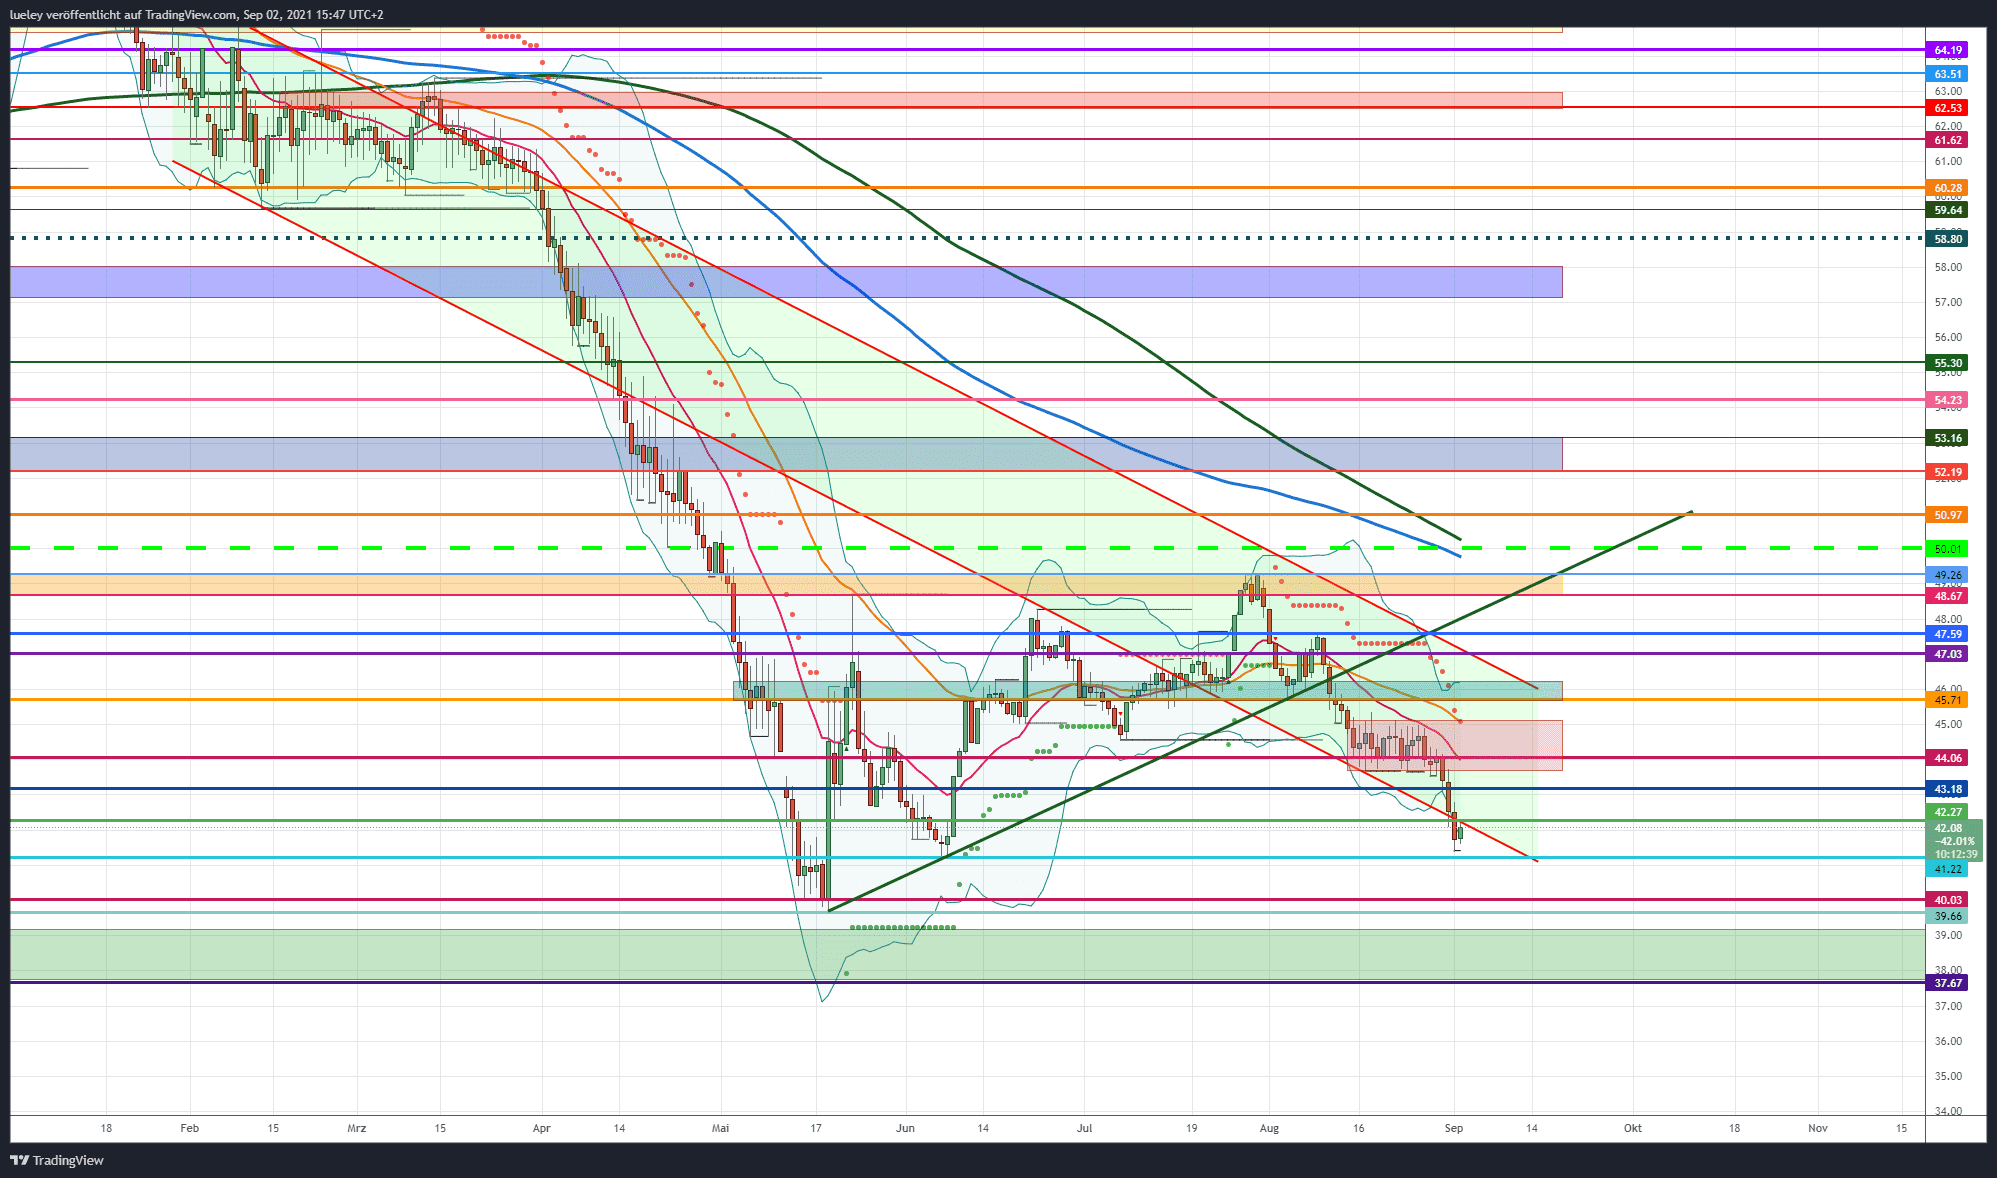
Bitcoin rises again this Thursday to the resistance at USD 50,325. After a temporary consolidation in the last seven trading days, the Bitcoin bulls are again targeting price targets above USD 50,000. The BTC rate was thus able to stabilize above EMA20 (red) and MA200 (green) for the time being. If Bitcoin manages to rise to USD 51,307 and break through it, price targets in the area of USD 53,005 and above will come into focus. As a central support level, USD 47,070 is therefore of great importance.
Bullish scenario (Bitcoin price)
After seven days of consolidation, Bitcoin tries again to attack the USD 50,000. If the bulls manage to stabilize the key crypto currency sustainably above USD 50,325 and subsequently break through the resistance at USD 51,307, the chart offers air to USD 53,005. Above this resistance there would be room to $ 54,077. A rise into this resistance zone brightens the chart image further. If the USD 54,077 is also overcome dynamically, a subsequent rise to the next target price at USD 55,817 is likely. This chart mark was fiercely contested several times in the past. If the buyer’s camp can muster enough strength to break through the USD 55,817 per day closing price, a walk through to the next higher-level target price of USD 57,998 should be planned. This is likely to lead to increased profit-taking again.
Only when Bitcoin overcomes this resistance level sustainably will the next target price be activated in the form of the old high at USD 59,470. Should investors manage to break the psychological USD 60,000 mark in the medium term, the USD 61,771 target will come into focus. In the medium term, another attack on the all-time high at USD 64,896 is conceivable. A break above the all-time high makes a subsequent rise to the 138 Fibonacci extension at USD 67,416 likely.
If there is no sustained setback below USD 60,000, Bitcoin will target the target range between USD 69,660 and USD 70,856. In the first attempt, however, there should be a rebound of up to USD 64,896 in this zone. If the bulls manage to stabilize the BTC price above this price mark in the coming months, Bitcoin should rise towards USD 70,000 and beyond. In the medium term, the maximum target range between USD 76,472 and USD 77,678 is moving into the focus of investors.
Bearish scenario (Bitcoin price)
Once again, the bears did not manage to keep the BTC rate below the minimum bearish price target of USD 47,070 per day’s closing rate. The sellers failed several times when trying to push Bitcoin to the MA200 or below. As a result, the cops took over the scepter again. As long as Bitcoin does not correct below USD 47,070 and subsequently not below USD 46,009, a new wave of corrections is unlikely. If a dynamic break of USD 46,009 succeeds, the support at USD 44,147 comes into focus. With the supertrend, the EMA50 (orange) and the lower Bollinger band, there are three important supports.
If this support level can be undercut dynamically, there is a risk of a relapse to 42,923 USD. If the BTC price continues to trend weakly, investors will focus on the green support zone between USD 41,334 and USD 40,585 as the target area. The EMA200 (blue) is currently also running here. If, contrary to expectations, there is no reversal and the Bitcoin price continues to weaken, a fallback to USD 39,240 should be planned. Breaking this support line suggests a corrective widening to $ 38,537.
If this support is also given up at the daily closing price, the downward dynamic gains momentum and pushes the price back to the 23rd Fibonacci retracement at USD 37,321. If this support also shows through, the next relevant price target will be activated at USD 36,643. If the bulls do not come back on the floor, a relapse to USD 34,899 is also conceivable. Below this price level, the USD 33,355 comes into focus. In the area of the 61 Fibonacci retracement, increased resistance from the bulls is again to be planned. A task, on the other hand, should bring Bitcoin immediately back to USD 31,603.
If the Bitcoin price breaks this support as well, the downward movement expands towards the maximum bearish target area between USD 31,010 and USD 30,000. For the time being, this course low in the purple support area represents the maximum price target on the underside. As long as the low of June 22nd at USD 28,795 is not abandoned, price targets at USD 26,399 or below are illusory for the time being. Furthermore, as long as Bitcoin stabilizes above USD 42,923, the bulls still have an advantage.
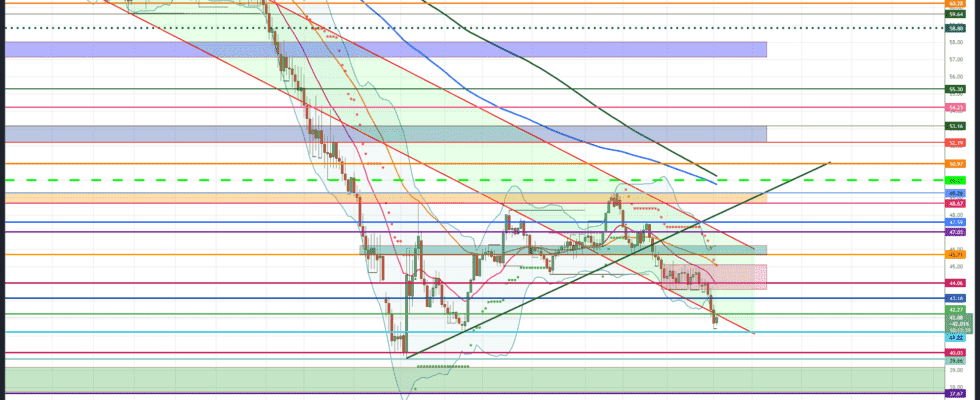
Bitcoin dominance: downward momentum is gaining momentum
The Bitcoin dominance has resolved the sideways phase mentioned in the last analysis bearishly and fell out of the red box towards the south at the beginning of the week. As a result, the BTC dominance hit several supports at 43.18 percent and 42.27 percentage points. Only just above the next relevant support at 41.22 percent did it turn north again and at the time of this analysis is trading in the area of the cross resistance at 42.08 percent. As long as the dominance of the crypto reserve currency does not jump back above 45.12 percent, a further relapse cannot be ruled out.
BTC Dominance: Bullish Scenario
Bitcoin’s relative weakness compared to many altcoins in recent days has further corrected its dominance in the overall market. Only today’s rise in Bitcoin is causing a technical countermovement in its market power. Now it is a short-term move back above the 42.27 percent in order to jump back into the green downtrend channel. If this resistance can be overcome by the daily closing price, the 43.18 percent will initially come back into focus. If this mark is overcome, the lower edge of the red box must be planned as the target area. The EMA20 (red) runs just above it at 44.06 percent, which then needs to be broken. A breakout above this resistance level activates the upper edge of the red box at 45.10 percent as a price target. There are two further strong resistances with the Supertrend and the EMA50 (orange). Only when these are broken at the daily closing rate is an increase of up to 45.71 percent or even 46.21 percent conceivable.
The upper Bollinger band currently also runs at 46.21 percent. An outbreak is not to be expected in the first attempt. If the BTC dominance manages to surely leave these price levels behind in the medium term, a subsequent increase of up to 47.03 percent and 47.59 percent is realistic. If the 47.59 percent is also permanently skipped, a march through to the orange resist zone is conceivable. A breakout above 48.67 percent brings the trend high from July 2021 at 49.26 percentage points into focus. If the dominance does not turn south here either, a directional decision at the psychological mark at 50.00 percent is likely.
In this area, two further strong resistance lines run with the EMA200 (blue) and MA200 (green). A direct breakthrough in BTC dominance is therefore unlikely. Only when these moving average lines can be overcome in the long term is an increase in the blue resistance zone between 52.17 percent and 53.16 percent conceivable. The maximum medium-term target price is still 54.23 percent.
BTC Dominance: Bearish Scenario
BTC dominance has decreased by more than five percentage points in the past seven trading days. Only in the support area of 41.22 percentage points did the dominance turn north on Thursday, September 2nd. Should Bitcoin’s market power drop below 41.22 percent, the next 40 percent mark should be targeted. If there is no clear reversal here, the downward trend extends to the area of the annual low at 39.66 percent. A dynamic break in this support brings the green support zone between 39.21 percent and 37.67 percent into focus as the target area. If the 37.67 percentage points are permanently abandoned, a correction up to the psychological 30 percent mark cannot be ruled out in the medium term.
Disclaimer: The price estimates presented on this page do not constitute buy or sell recommendations. They are only an assessment of the analyst.
The chart images were created using TradingView created.
USD / EUR exchange rate at the time of going to press: 0.84 euros.