
- Course (ADA): $0.35 (previous week: $0.38)
- Resistances/Goals: $0.39, $0.43, $0.46, $0.50, $0.53, $0.60, $0.64, $0.68/0.70, $0.75
- Supports: $0.33, $0.26, $0.23, $0.19, $0.13, $0.11
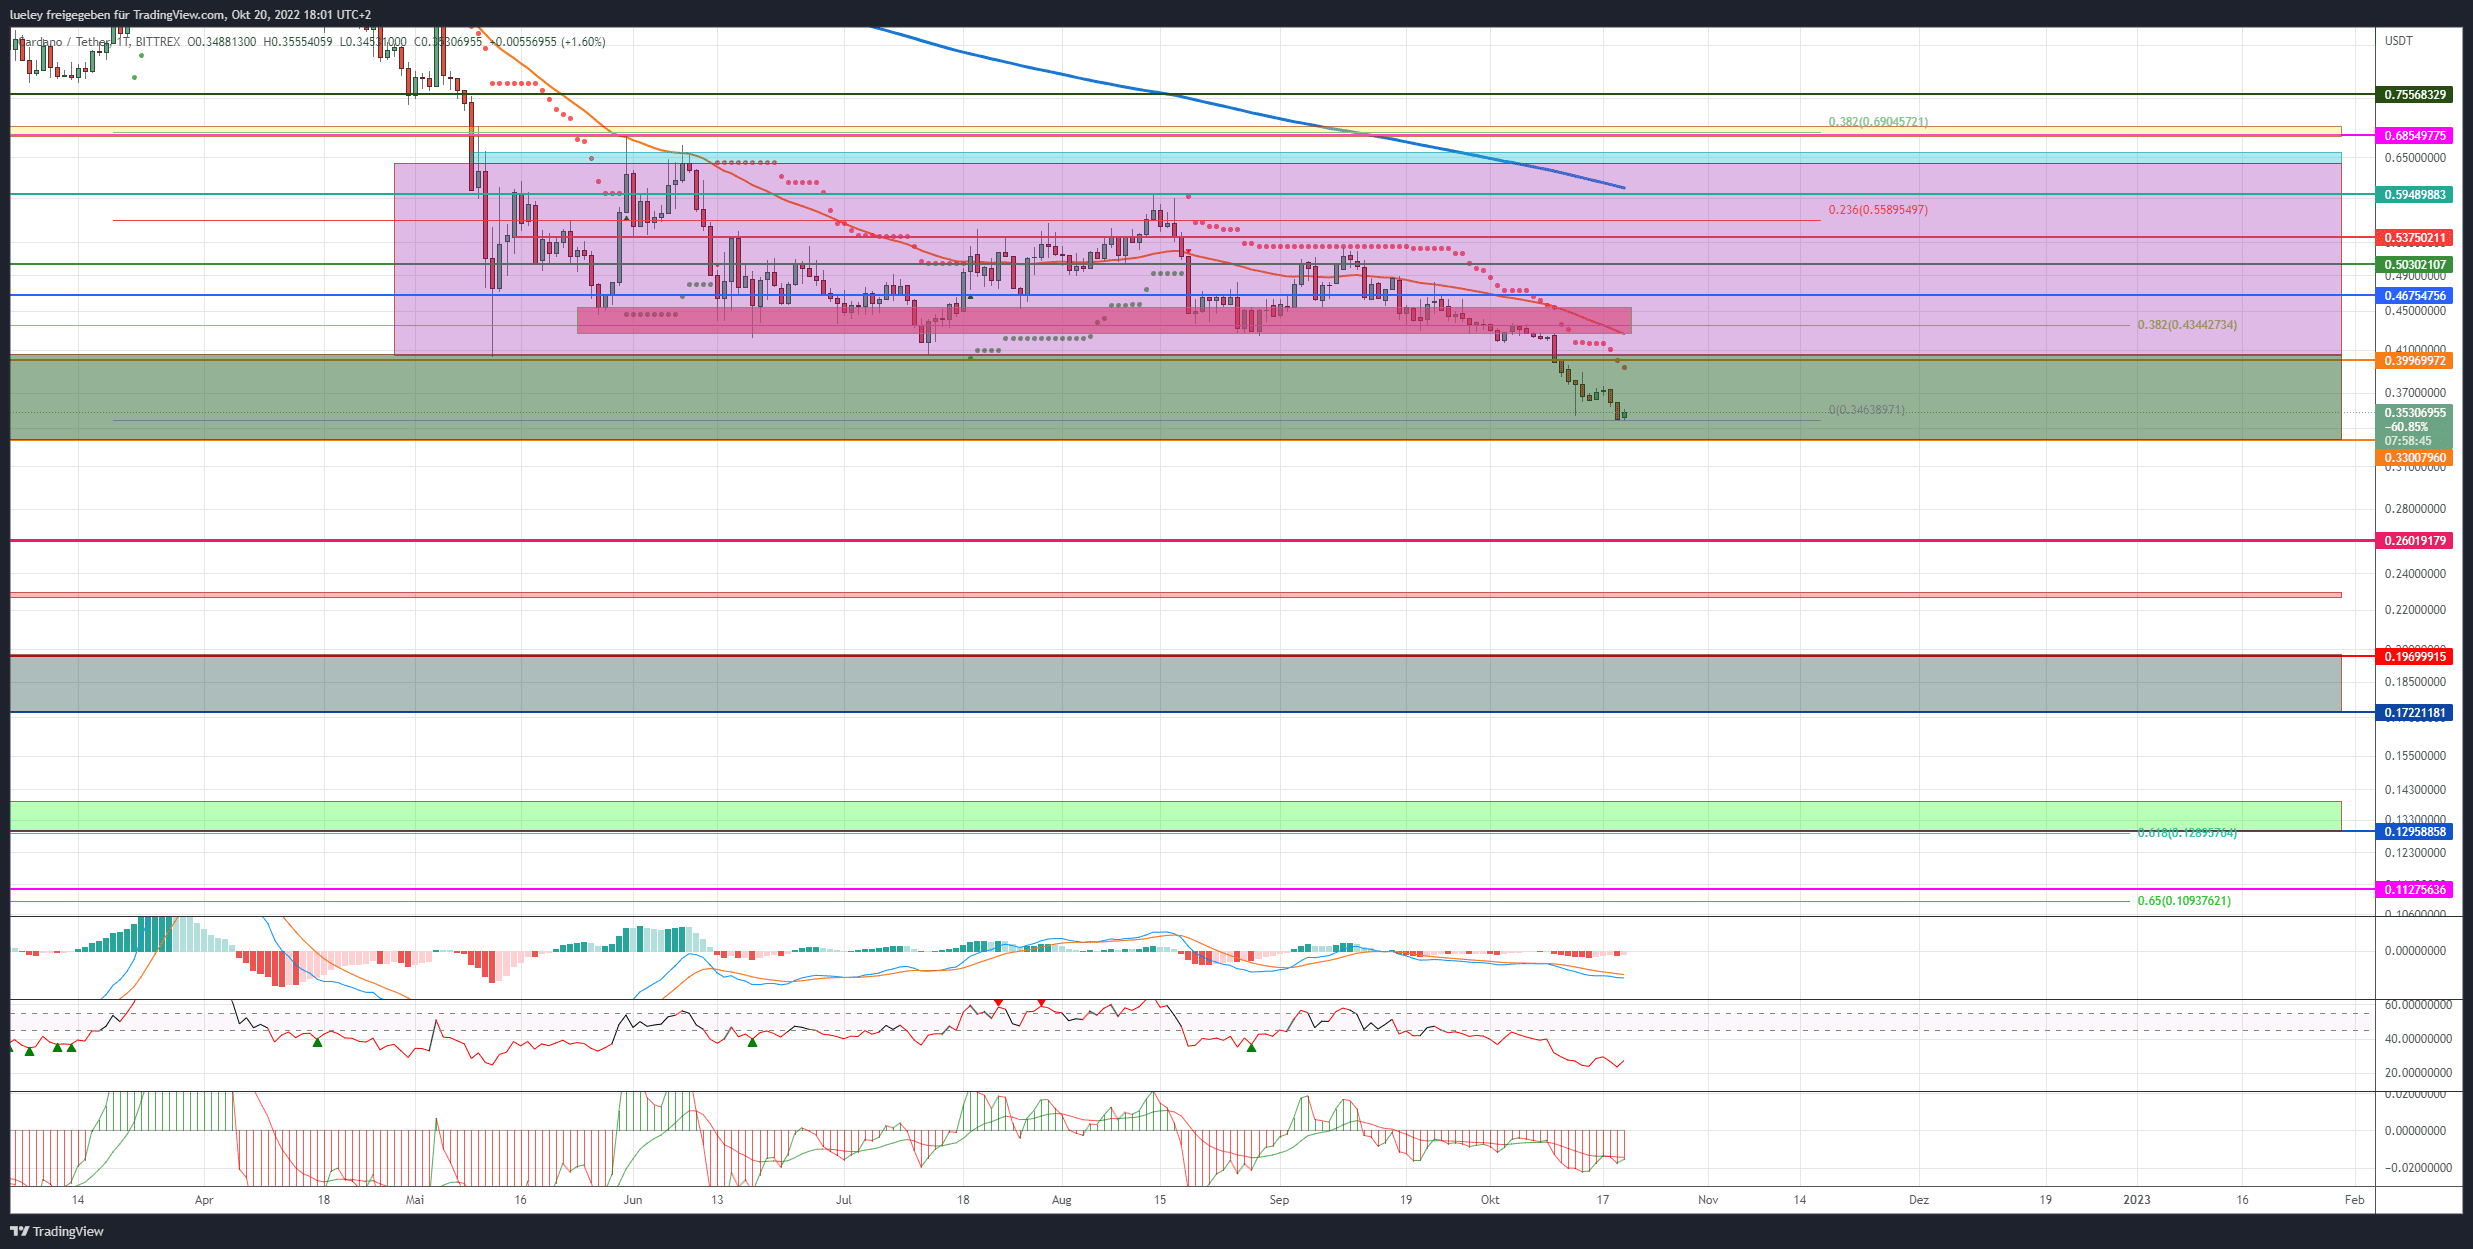
Course analysis based on the pair of values ADA/USD on Bittrex
Cardano Recap:
- The price increase hoped for by many investors after the successful implementation of the Vasil hard fork in the previous month did not materialize.
- Instead, ADA price corrected back towards its yearly low of $0.39.
- In the course of the ongoing sideways phase of the key crypto currency Bitcoin (BTC), investors have recently increasingly sold their Cardano positions.
- On October 10, the ADA price finally broke through the relevant support in the area of the low for the year.
- As a result, the Cardano price slipped more significantly south and marked a new low for the year at USD 0.34 on Thursday, October 20th.
- Despite a recent significant increase in network activity in the Cardano network, the price is currently unable to recover and continues to trend bearish.
- The ADA course thus seems to be approaching the important support mark at USD 0.33 in a timely manner.
- This tendency coincides with the consideration of the indicators RSI and MACD. Both indicators show active sell signals in the daily chart. Although the RSI is clearly in the oversold area with a value of 27, this alone should hardly be enough to initiate a sustained bullish countermovement.
- The buyer side must now do everything possible to recapture the important price mark of USD 0.39 as quickly as possible.
- Only when the price stabilizes above this level should we look back towards the first target at USD 0.43.
Bullish scenario (Cardano):
- Since abandoning the key support at USD 0.39, the ADA price has clearly trended south.
- For the bull side, it is now important to stabilize the ADA price in the area of USD 0.33 in the long term in order to start a recovery rally as a result.
- If a timely jump back above the area around USD 0.40 is successful, the first price hurdle in the area of the cross-resistance from the higher-level Fibonacci retracement of 38 and EMA50 (orange) in the daily chart is waiting at USD 0.43.
- If this price level is immediately overcome, Cardano should quickly rise back to around USD 0.46.
- If Cardano then breaks above this resist, the recovery will continue to gain momentum. Then a march over the USD 0.50 in the direction of the USD 0.53 would have to be planned. In this area at the latest, renewed resistance on the part of the seller is to be planned.
- If the ADA bulls can also clear this resistance and break through the 23 Fibonacci retracement of the current trend movement, the strong resistance at USD 0.60 will come back into the eyes of investors.
- Cardano’s course last failed here in August of this year. Since the EMA200 (blue) also runs in this chart area, a direct price jump in the direction of the turquoise resistance zone is not to be expected.
- The maximum price target for Cardano must now be adjusted significantly downwards. A breakout above the 38 Fibonacci retracement at USD 0.69 is unlikely in the next few months. At best, Cardano could try a short spike up to the old tear-off edge at USD 0.75.
Bearish Scenario (Cardano):
- The bears took advantage of Bitcoin’s sustained sideways movement and pushed the price below the important $0.39 mark.
- As discussed in the last price analysis on September 6th, a fall below the low for the year should result in another sell-off.
- A persistently low trading volume made it easier for the seller to sell off towards USD 0.33.
- At this point at the latest, however, the bulls must take action to avert a sell-off at Cardano.
- If the bulls also give up this support level without resistance, the correction will widen further towards USD 0.26.
- If there is no trend reversal to the north here either, an extension of the correction movement up to USD 0.23 is likely.
- This would also put the overarching bearish target range between USD 0.19 and USD 0.17 within reach. Here the buyer camp must take heart and stabilize the course of Cardano.
- If the attempt at a recovery movement also fails here, a fall back to the maximum bearish price target in the area of the parent Golden Pocket between USD 0.13 and USD 0.11 can no longer be ruled out.
- However, such a strong price slide into this chart region is only conceivable with a simultaneous sell-off of Bitcoin in the direction of USD 13,500.
Disclaimer: The price estimates presented on this page do not represent buy or sell recommendations. They are merely an assessment by the analyst.
The chart images were created using TradingView created.
USD/EUR exchange rate at the time of going to press: EUR 1.03.
You want to buy Cardano (ADA)?
You can easily do that via eToro. The provider offers investors, from beginners to experts, a comprehensive crypto trading experience on a powerful yet user-friendly platform. Cardano staking is also possible here. We took a close look at eToro.
To the eToro review