
Bitcoin (BTC): First attempts at bottoming out in the 4-hour chart
BTC rate: $22,629 (previous day: $31,700)
Short-term resistances/goals: $23,289, $24,291, $25,460, $26,170, $27,074, $27,975/27,696, $28,607, $29,256, $29,975, $30,612, $31,750, $32,383
Short-term supports: $21,892, $20,816, $19,884, $19,500, $17,860, $15,000
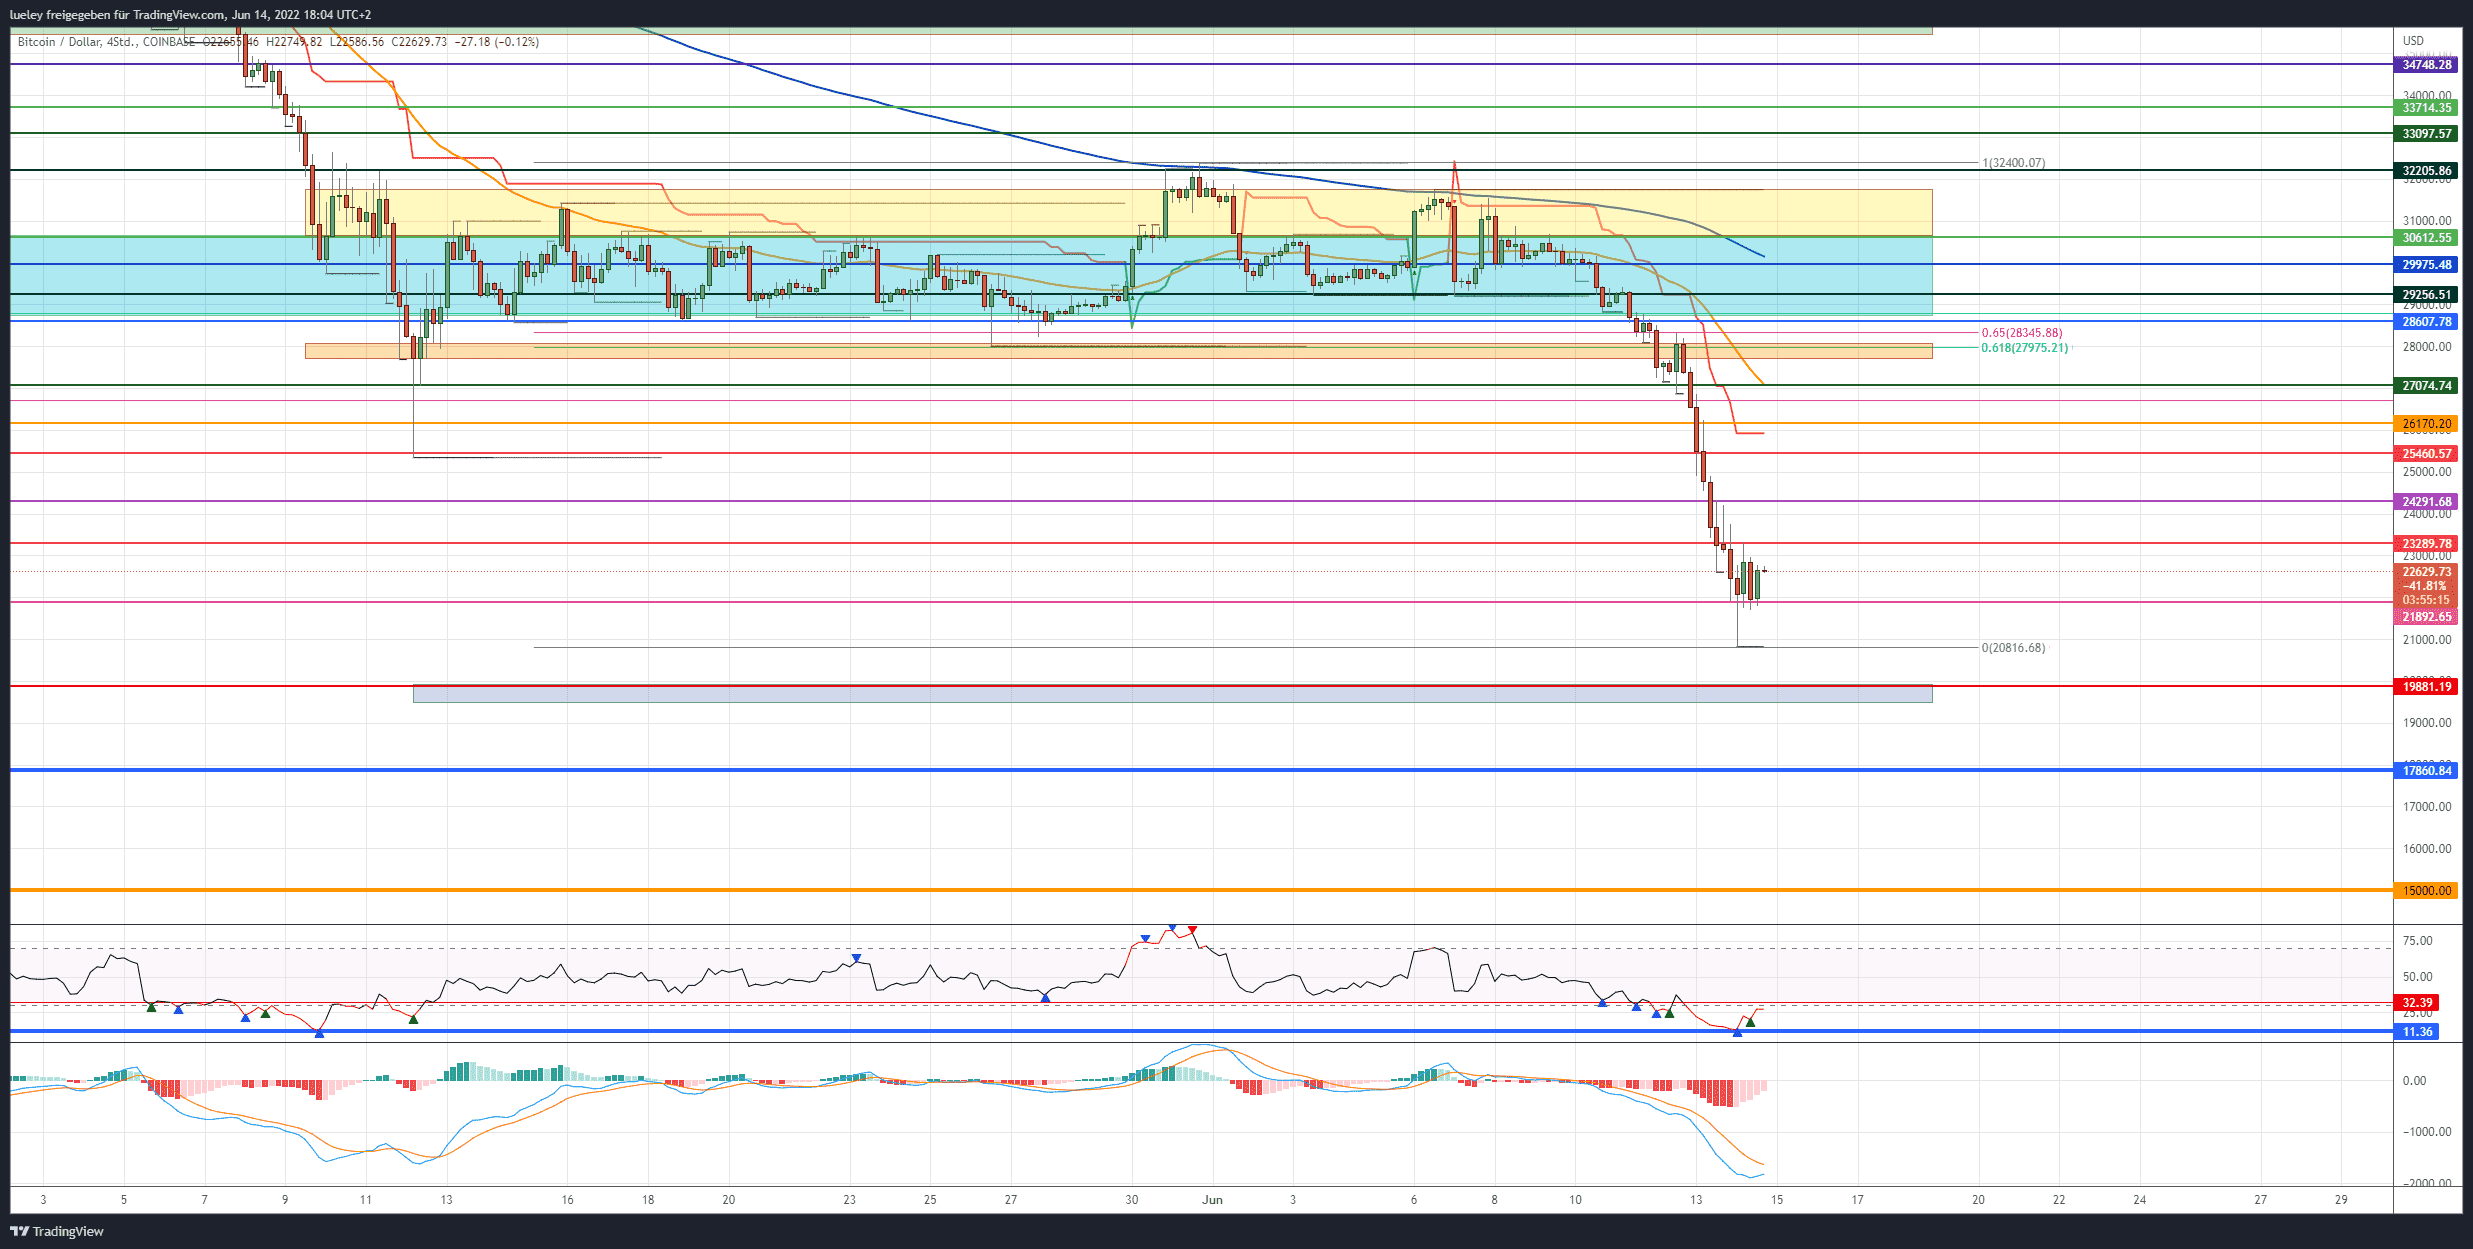
4-hour chart Price analysis based on the pair of values BTC/USD on Coinbase
Recap Bitcoin:
- While the key crypto currency Bitcoin was initially able to stabilize in the USD 30,000 range last week, last Friday, June 10, as a result of the disastrous inflation figures in the USA, the turquoise sideways channel broke dynamically downwards.
- Bitcoin broke the key supports at $28,005 and $27,047 the following day. On Sunday, the last trading day of the week, the downward momentum increased further. A massive drop in the price of the lending provider Celsius caused panic selling on the entire crypto market in the night from Sunday to Monday.
- Bitcoin broke the yearly low at USD 25,350 and immediately slid to the support at USD 21,892 in a few hours.
- Although this support was also fallen short of this morning and Bitcoin fell back to USD 20,816, in the hours that followed it was able to save itself several times in the following hours with a 4-hour closing price above the important support at USD 21,892.
- This support level acts as the last relevant support for the bulls before the psychologically important USD 20,000 level.
- Overall, almost $1 billion in long bets on Bitcoin were liquidated during this period. Yesterday Monday alone it was more than 500 million US dollars within 24 hours.
- The total market capitalization also fell significantly south, falling back below $1 trillion to $860 billion.
- The two major US stock indices also reached this Tuesday afternoon Nasdaq100 and SP500 strong support levels.
- Since many investors are waiting for the US Federal Reserve’s interest rate decision, a sideways phase is to be expected in the short term until 8:00 p.m. (CET) tomorrow, Wednesday.
- Bitcoin is currently trading in the area of the moving average line of the last few weeks at USD 22,362. This important support line has been the target of corrections in Bitcoin several times in the past. Therefore, the price could also stabilize.
- Looking at the indicators, the RSI in the weekly chart has now returned to oversold territory with a value of 29, which could also indicate a possible technical countermovement in the medium term.
Bullish Scenario (BTC):
- The bulls are currently recovering from the massive price drop of the last 96 hours of trading.
- If Bitcoin can stabilize above USD 21,892 on a 4-hour basis and subsequently recapture its daily high of USD 23,289, the resistance at USD 24,291 will initially come into focus as a target. Here the BTC course should fail at the first attempt.
- If the buy side breaks this resist, the recovery will initially extend to the $24,460 to $26,170 area. The supertrend in the 4-hour chart also runs here. A price bounce is therefore very likely.
- If Bitcoin also breaks through this resistance area in the coming trading days, and the EMA50 (orange) in the area of USD 27,074 is also recaptured, a retest of the tear-off edge at USD 27,975 is to be planned.
The targets on the top are limited
- In addition to the tear-off edge, the golden pocket of the current price movement can also be found here.
- At most, Bitcoin could briefly touch USD 28,607 before another course correction back south is to be expected.
- Should Bitcoin, contrary to expectations, be able to recapture this strong resistance area, a price recovery up to USD 29,256 and USD 29,975 is conceivable. Since the EMA200 (blue) is also in the USD 30,000 area, it should be difficult for the bulls to climb back towards the monthly highs.
- The maximum target range for the coming trading weeks can be found between USD 31,750 and USD 32,383. For the time being, a reconquest of this zone is difficult to imagine. The bears will want to counterattack in this area at the latest.
Bearish Scenario (BTC):
- In the last week, the bears not only parried every attack on the buyer side, but also sold off the key crypto currency with high volume.
- Any attempts by the bull camp to stabilize Bitcoin in the $28,000 area were thwarted by the sell side.
- As a result, the bears broke through the low for the year at USD 25,349 on the night from Sunday to Monday. By triggering many stop-loss orders, the sell-off momentum increased significantly. This sent Bitcoin straight to support at $21,892. In the early hours of Tuesday, Bitcoin fell as low as $20,816 before recovering back above $21,892. Bitcoin has all closed the last four 4-hour candles above this support level.
- The BTC price seems to have stabilized by 30 percent within three trading days after this strong sell-off. However, tomorrow evening’s interest rate decision could already initiate a new wave of selling below today’s low.
Old all-time high comes into view
- If the dynamic falls below USD 20,816, a retest of the old all-time high from December 2017 between USD 19,500 and USD 19,881 can be expected. In the first attempt, Bitcoin should bounce north here.
- However, should the stock market continue to come under significant pressure as a result of the Fed’s decision, a sell-off of up to USD 17,860 is also conceivable. This is where the overarching 78 Fibonacci retracement from the weekly chart runs.
- The bulls are likely to want to use this price mark more for long entries.
- If there is no sustained recovery movement in the coming trading weeks and Bitcoin slips below USD 17,860 at the daily closing price, the maximum target price of USD 15,000 will become the focus of investors. This support level is taken from the monthly chart.
- As long as the buyer side can defend the area around the psychologically important USD 20,000 mark, a bottoming out cannot be ruled out here either.
Disclaimer: The price estimates presented on this page do not represent buy or sell recommendations. They are merely an assessment by the analyst.
The chart images were created using TradingView created.
USD/EUR exchange rate at the time of going to press: EUR 0.96.
Set up a bitcoin & crypto savings plan
Invest regularly in Bitcoin and benefit from the cost-average effect in the long term. We’ll show you how.
To the guide