
Francois Langot, Le Mans University and Fabien Tripier, Paris Dauphine University – PSL
This exceptional resilience of the French economy remains strongly linked to the measures to support activity taken by the government since the start of the health crisis: without them, the fall in GDP would have been 37 points of GDP, and the level of Pre-crisis GDP would have recovered after 13.5 quarters, according to our estimates made for the Center for Economic Research and its Applications (Cepremap). The combination of the increase in public spending in the short term, relayed by a reduction in the tax burden in the medium term, explains this dynamic.
These exceptional measures had the counterpart of increasing the debt-to-GDP ratio, which reached 115%. However, our analysis shows that if the government had not taken these measures, then the debt ratio could have reached 145% given the collapse in activity.
Finally, the programming of public expenditure and tax relief provided for in the draft finance law (PLF) 2022 puts France on a stronger GDP growth trajectory (1.65%) than that observed during the two previous five-year periods ( 1.5%).
This relative good health of the French economy at the end of 2021 must however be assessed with caution, as the health situation has not stabilized. It is nevertheless useful to assess the effectiveness of the measures already taken and to deduce the outlook for the French economy in the coming period.
More than a year of winning
The health crisis has resulted in economic terms by an unprecedented restriction of national exchanges, both on the market for goods and services and on the labor market, and international exchanges. Exceptional economic policy measures were then taken, modifying public consumption (employment, education, health, culture, etc.), public investment (R&D, weapons, buildings and infrastructure), and taxation (taxation of companies and Household).
Chart 1: The Covid-19 crisis in the absence of macroeconomic policies. Note: Real GDP per capita observed (black line), forecast by the PLF 2022 (blue line) and simulated by the CEPREMOD model in the absence of macroeconomic policies (red line). Index 100 in 2020 Q1. PLF 2022 and authors’ calculations
Chart 1 compares the “real” trajectory of the French economy (black and blue lines) with a scenario where the exceptional budgetary and fiscal measures taken by the government are eliminated (red line). It shows how these policies protected the French economy from a crisis that would have been even greater.
In both cases, with or without the supportive policies, the trough in economic activity occurs in the third quarter of 2020, following the lockdown of the economy. The contraction observed is -17% compared to the pre-crisis situation, whereas in the absence of exceptional measures, the drop in economic activity is estimated at -37%. At the height of the crisis, macroeconomic policies would therefore have prevented losses of around 20 percentage points of 2019 GDP.
Over the four years following the crisis, the measures have made it possible to avoid even greater losses of GDP. Indeed, while observed GDP has already almost returned to its pre-crisis level (it is one percentage point below), it would be nearly 10 percentage points below its pre-crisis level without these exceptional measures. Without these policies, the level of activity of 2019 would not be reached until the first quarter of 2023, i.e. more than a year late (5.5 quarters).
The increase in public consumption explains most of the losses avoided during the first two years following the crisis (up to 85% over the period 2020-2021), while tax relief plays a major role for the following years (up to 85% over the 2022-2023 period). Public investment explains the rest (around 15%), evenly over the entire period.
Public debt finally contained
Macroeconomic policies to support economic activity represented a significant financial burden for the State in a context of limited tax revenues due to the slowdown in economic activity. They have therefore led to large public deficits, increasing the level of public debt.
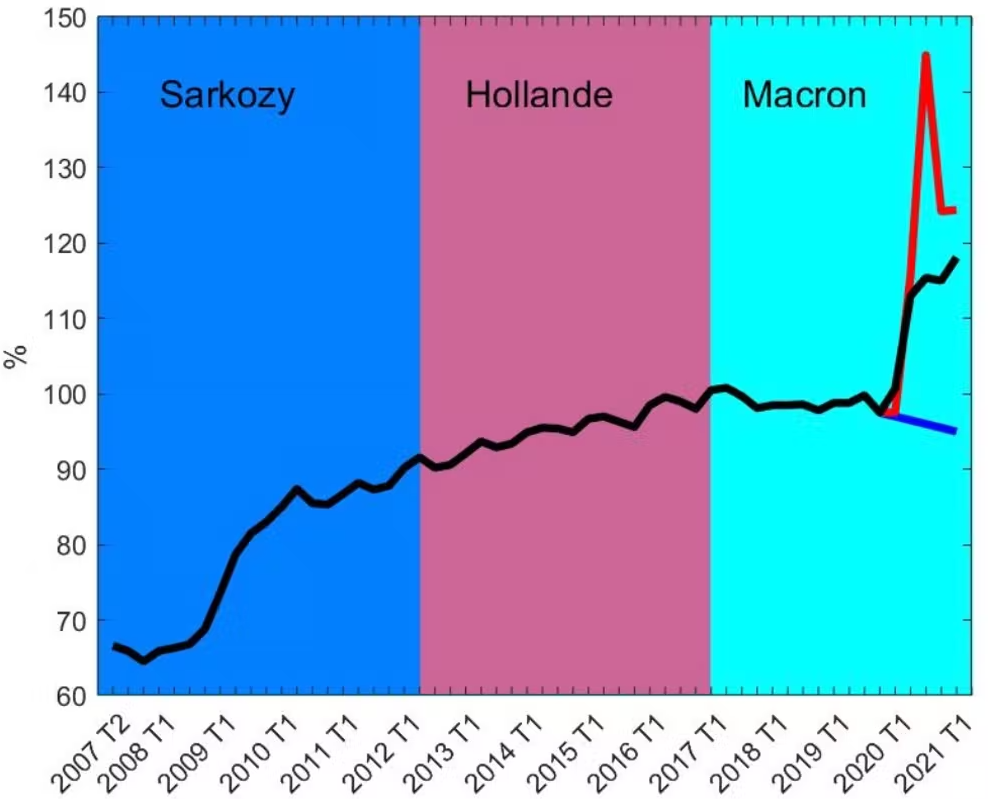
Chart 2: Evolution and simulation of public debt (as % of GDP) in the absence of macroeconomic policies. Note: Debt in the Maastricht sense of general government in points of observed GDP (black line), forecast before the Covid-19 crisis by the PLF 2019 (blue line) and simulated by the Cepremod model in the absence of macroeconomic policies ( red line). Insee, PLF 2019 and authors’ calculations
Would giving up these support policies have made it possible to limit the increase in public debt? Chart 2 compares the observed change in public debt to what it would have been without the exceptional measures to support activity.
Public debt as a percentage of GDP increased by more than 20 points during Nicolas Sarkozy’s five-year term, mainly due to the financial crisis of 2008-2009. During François Hollande’s five-year term, it progressed slowly, while this period did not experience any major crisis (during this period, the German debt fell from 88% to 70% of GDP), to stabilize around the level of 100% GDP at the start of Emmanuel Macron’s five-year term.
The management of the Covid-19 crisis increased this ratio by 15 percentage points, bringing public debt to a level of 115% of GDP at the end of 2021. Without the measures to support the economy, the he worsening of the economic crisis would have led to an even sharper rise in the public debt ratio. According to our simulations, this ratio would indeed have reached a level of 145% of GDP from the third quarter of 2020 (see the red curve in Chart 2).
This difference of 30 points in the debt ratio between the two scenarios is explained by the greater scale and greater persistence of the crisis which would then have taken place without the support measures (see above). In conclusion, the “whatever the cost” policy seems to have been a better operation for public finances than a “laissez-faire” policy, framed by the Maastricht criteria.
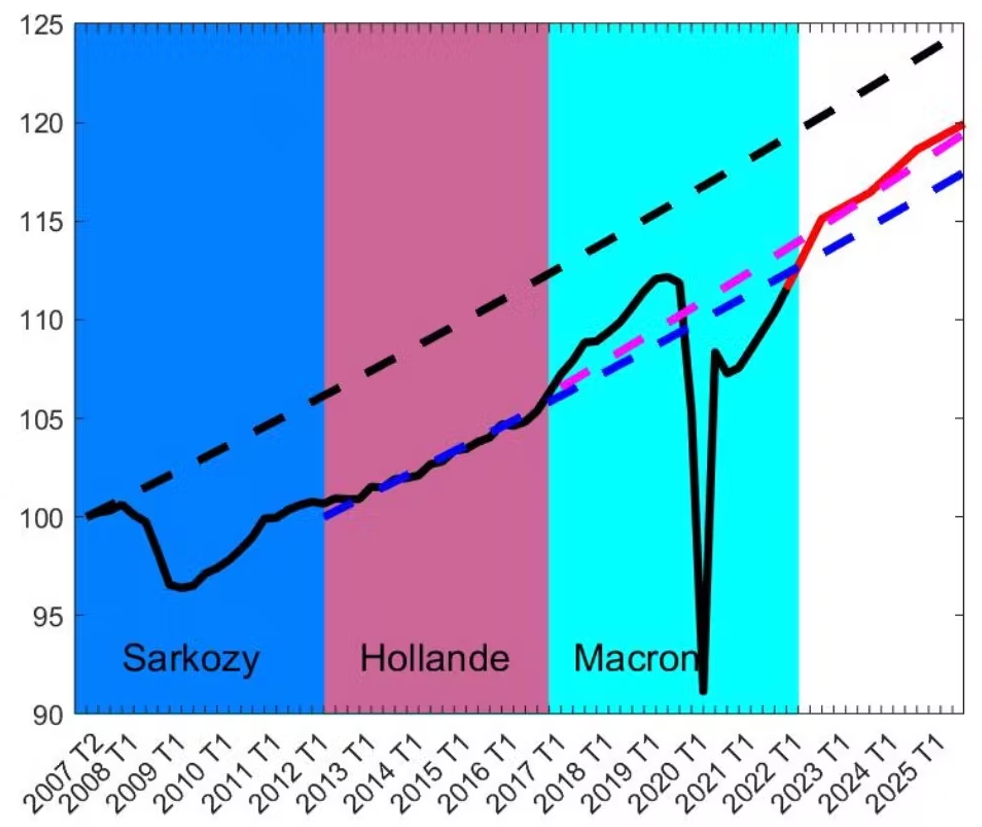
Chart 3: Evolution since 2007 and forecasts until 2025 of GDP per capita in France. Note: Real GDP per capita observed (solid black line) and forecast by the PLF 2002 (solid red line) from 2021 Q4 (index 100 in 2017 Q2). Trends in real GDP per capita of 1.2% from the start of the mandates of Mr. Sarkozy (black dashes), Mr. Hollande (blue dashes) and of 1.35% for the start of Mr. Macron’s mandate (dashes roses). PLF 2022 and authors’ calculations
The government presented its budgetary and tax policies until 2025 in the PLF 2022. Under the assumption that there will be no new epidemic wave, graph 3 shows that these policies anchor France at a rate of 1 .35% annual growth per capita (i.e. 1.65% growth by adding population growth). This growth is therefore higher than during the two previous five-year periods (growth of 1.2% per capita, or 1.5% by adding population growth).
Beyond the cushioning of the crisis, the macroeconomic policy undertaken, through permanent tax cuts and support for public investment, therefore seems to have positive effects in the medium term on the rate of growth.
Francois Langot, Professor in Economics, Le Mans University and Fabien Tripier, Professor of Economics, Paris Dauphine University – PSL
This article is republished from The Conversation under a Creative Commons license. Read the original article.