Hardly digested the Terra shock, a new problem child on the crypto market puts the stress limit of investors to a hard test: FTT – the token of the troubled exchange FTX – collapsed overnight. At the beginning of the week, the price was 22 US dollars and it is currently at 3 US dollars. A discount of 85 percent. Which may have caught most investors off guard – but not all.
FTX: A bang with an announcement
While the rumor mill was still buzzing at first, it is now clear: FTX is on the brink of extinction. The fourth largest crypto exchange in terms of trading volume has miscalculated and made itself too dependent on its own token. After it became public that the hedge fund Alameda Research, which belongs to FTX, lives on FTT pump, the house of cards collapsed. More about the background here.
The fact that FTX has reached a dangerous drop could already be seen in advance – on the price chart of the FTT token. In the BTC-ECHO podcast, market experts Stefan Lübeck and Peter Büscher spoke on Monday about the scenario of a price crash. And predicted that if FTT falls below $22, it will slide straight to $4. Said and done. But why actually?
The art of charting
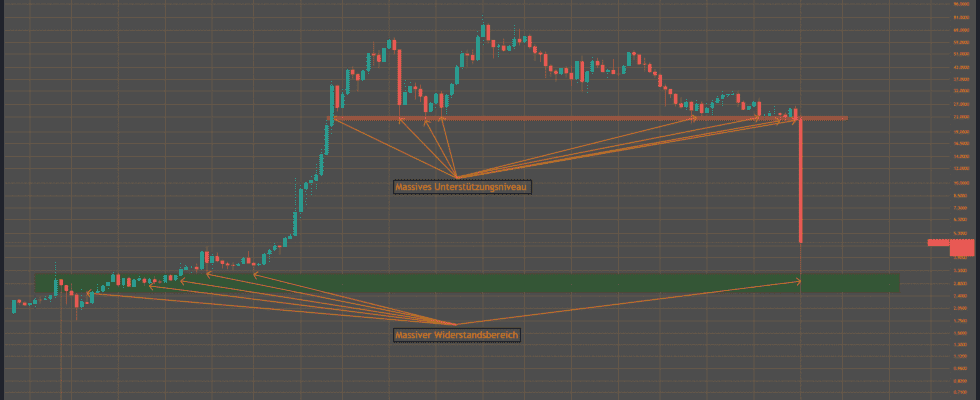
Trading language, difficult language: The world of Bollinger Bands, Fibonacci Retracements and Head and Shoulders Pattern is difficult for outsiders to understand. But even without much trading knowledge, the price drop could be read. The chart below shows the FTT price on a weekly chart. The green and red bars, also called candlesticks, signal whether the price has risen (green) or fallen (red).
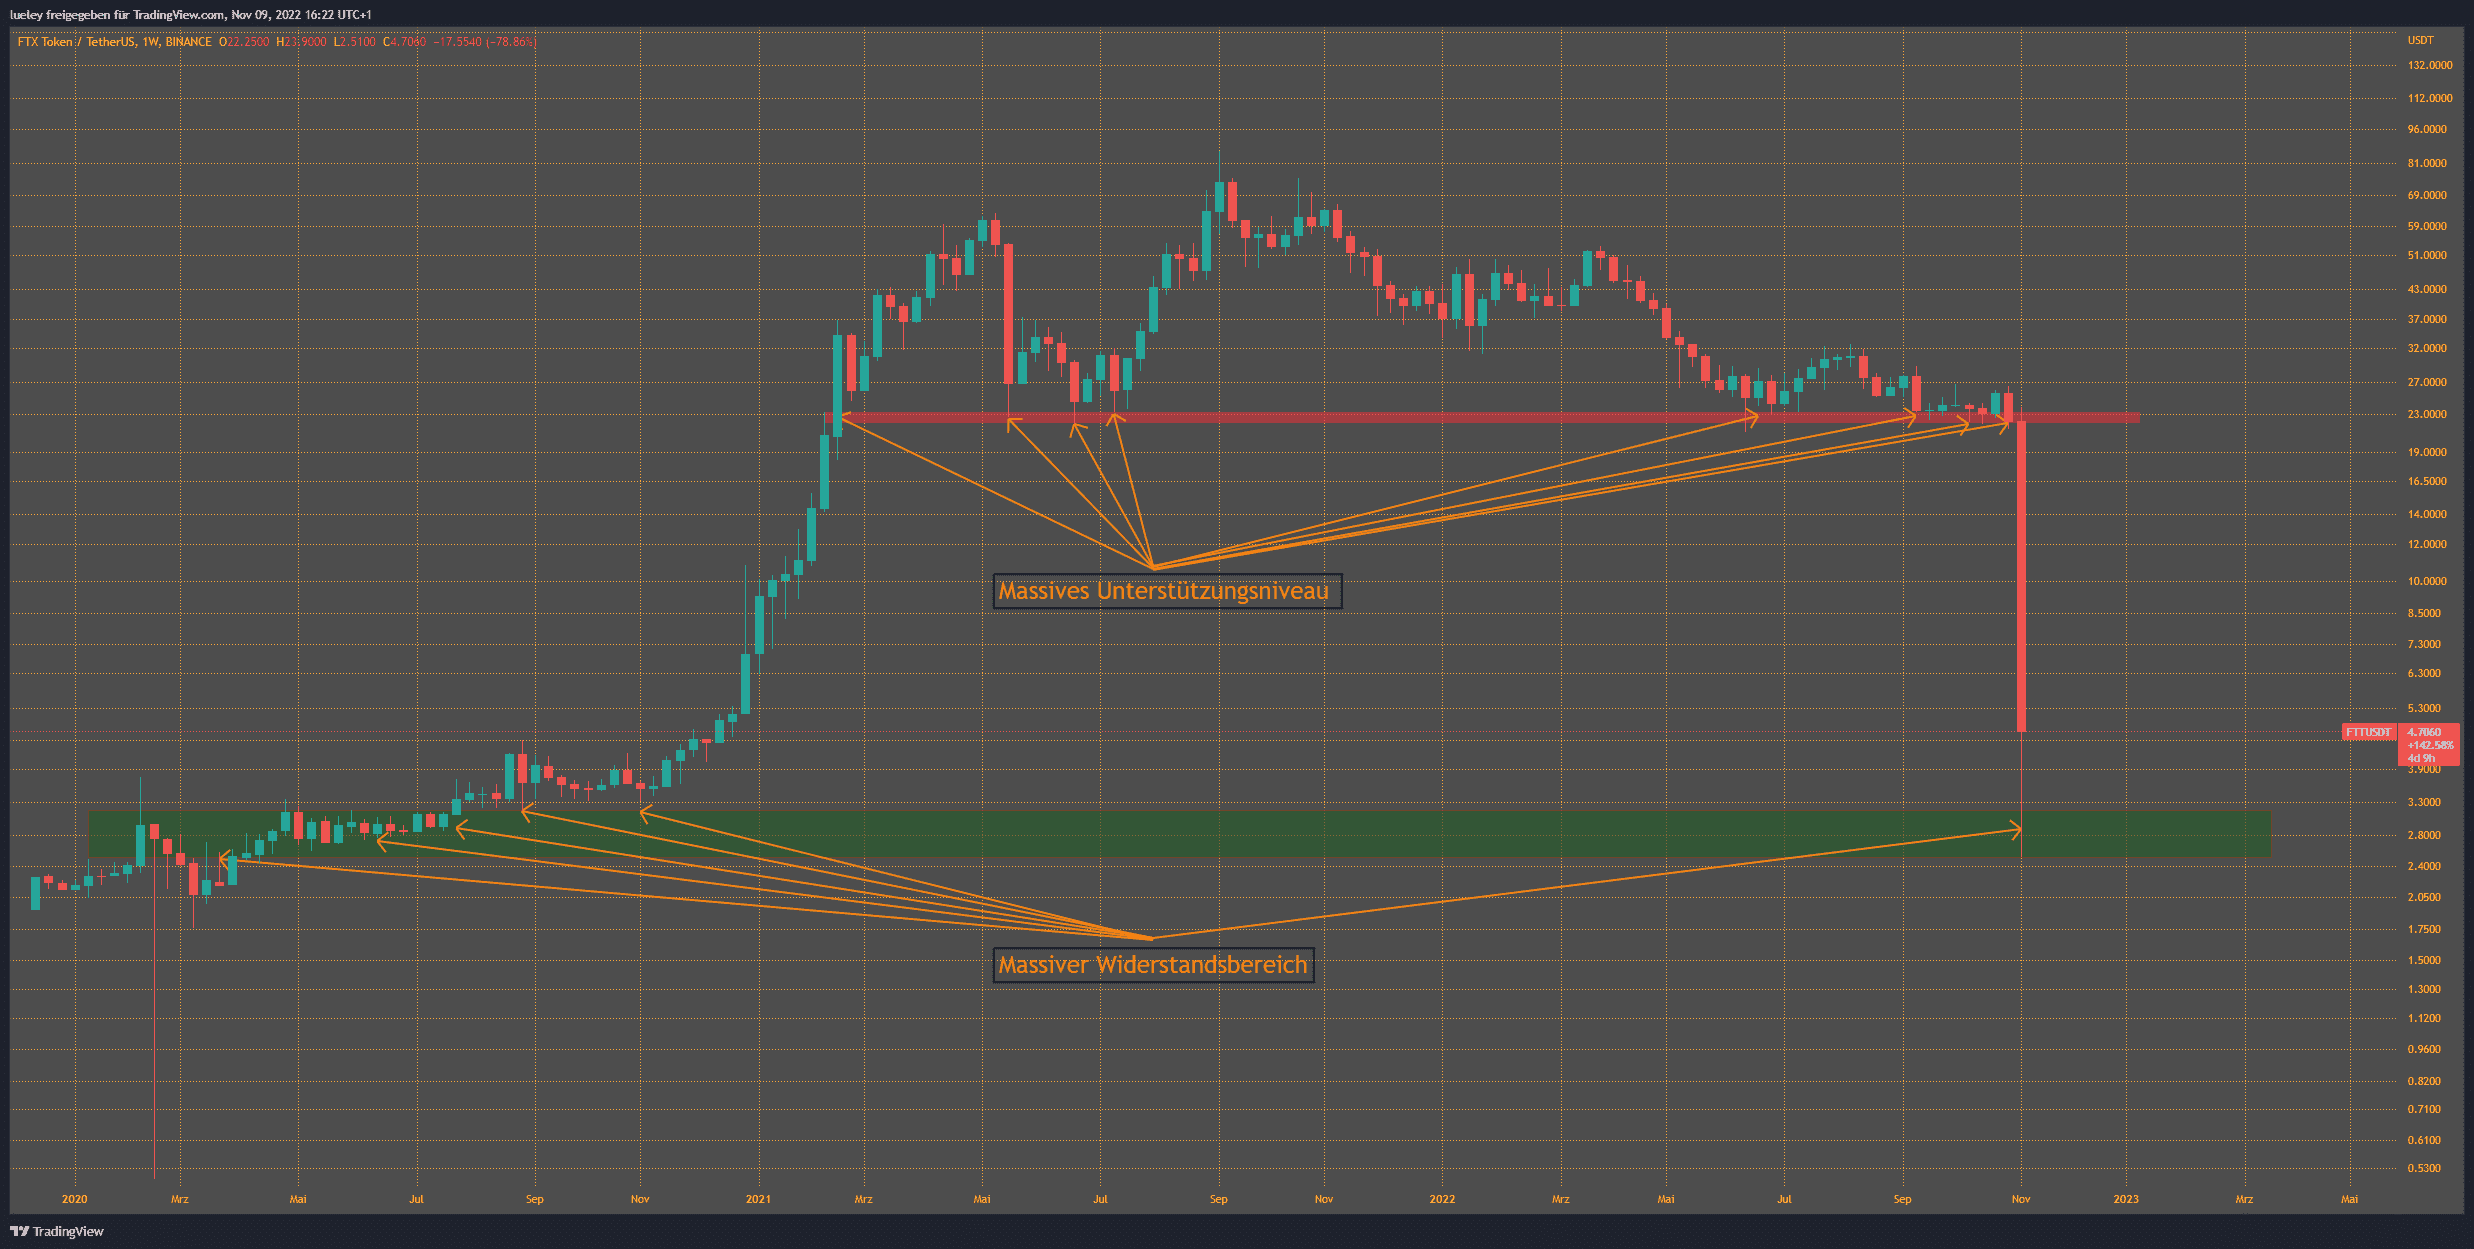
What is striking: Between November 2021 and March 2022, the price rose without any significant setback. That should now prove to be the pitfall. Without countermovements, there is also no bottom that can serve as support and absorb the course at certain points.
This only formed at a price level of 22 US dollars (red line). As can be seen on the chart (orange arrows), there were always points where the price was held by the support level. The more contact points there are, the stronger the support.
However, there were no support points between the support level and the resistance area (green line) that could avert the price crash. As bankruptcy rumors spread around FTX and investors sold their FTT tokens, downward momentum developed that pushed the price straight back into the resistance area.
There are two developments here. For one, mass stop-loss orders were triggered below the support level, increasing selling pressure. In addition, investors have opened additional short positions. The downward spiral was accelerated by the leveraged short selling.
Now, FTT is where a strong area of resistance formed during the summer 2021 sideways trend: $3. The prediction of the price drop was anything but witchcraft, with a little practice crash scenarios can be recognized in advance. And prevent losses.
Do you want to buy cryptocurrencies?
Trade the most popular cryptocurrencies like Bitcoin and Ethereum as an ETP on Scalable Capital, the leading investment platform in Europe.
The latest issues of BTC-ECHO Magazine
You might also be interested in this