The price of the Ripple coin XRP has held up relatively well in the past few days. The XRP course thus escaped the weakness in the crypto market, which was hit harder in the course of the SEC lawsuit against Binance and Coinbase. The market capitalization of all altcoins has fallen by 15 percent in the last seven trading days and is currently still in the double-digit range. On the other hand, Ripple was able to rise to a new 30-day high at $0.566 in a first reaction after the publication of the Hinman documents.
Although Hinman’s statements contradict the classification of XRP as a security from Ripple’s point of view, it was not enough for the long-term liberation of the XRP course for the time being. In view of the unclear situation, some investors parted from their XRP positions and temporarily pushed the price down to the supertrend support at $0.464 before a countermovement began. At least the bulls managed to stabilize Ripple’s price above the horizontal support line at $0.480 for the time being. This means that the chance for a bullish trend movement in the coming period remains unchanged.
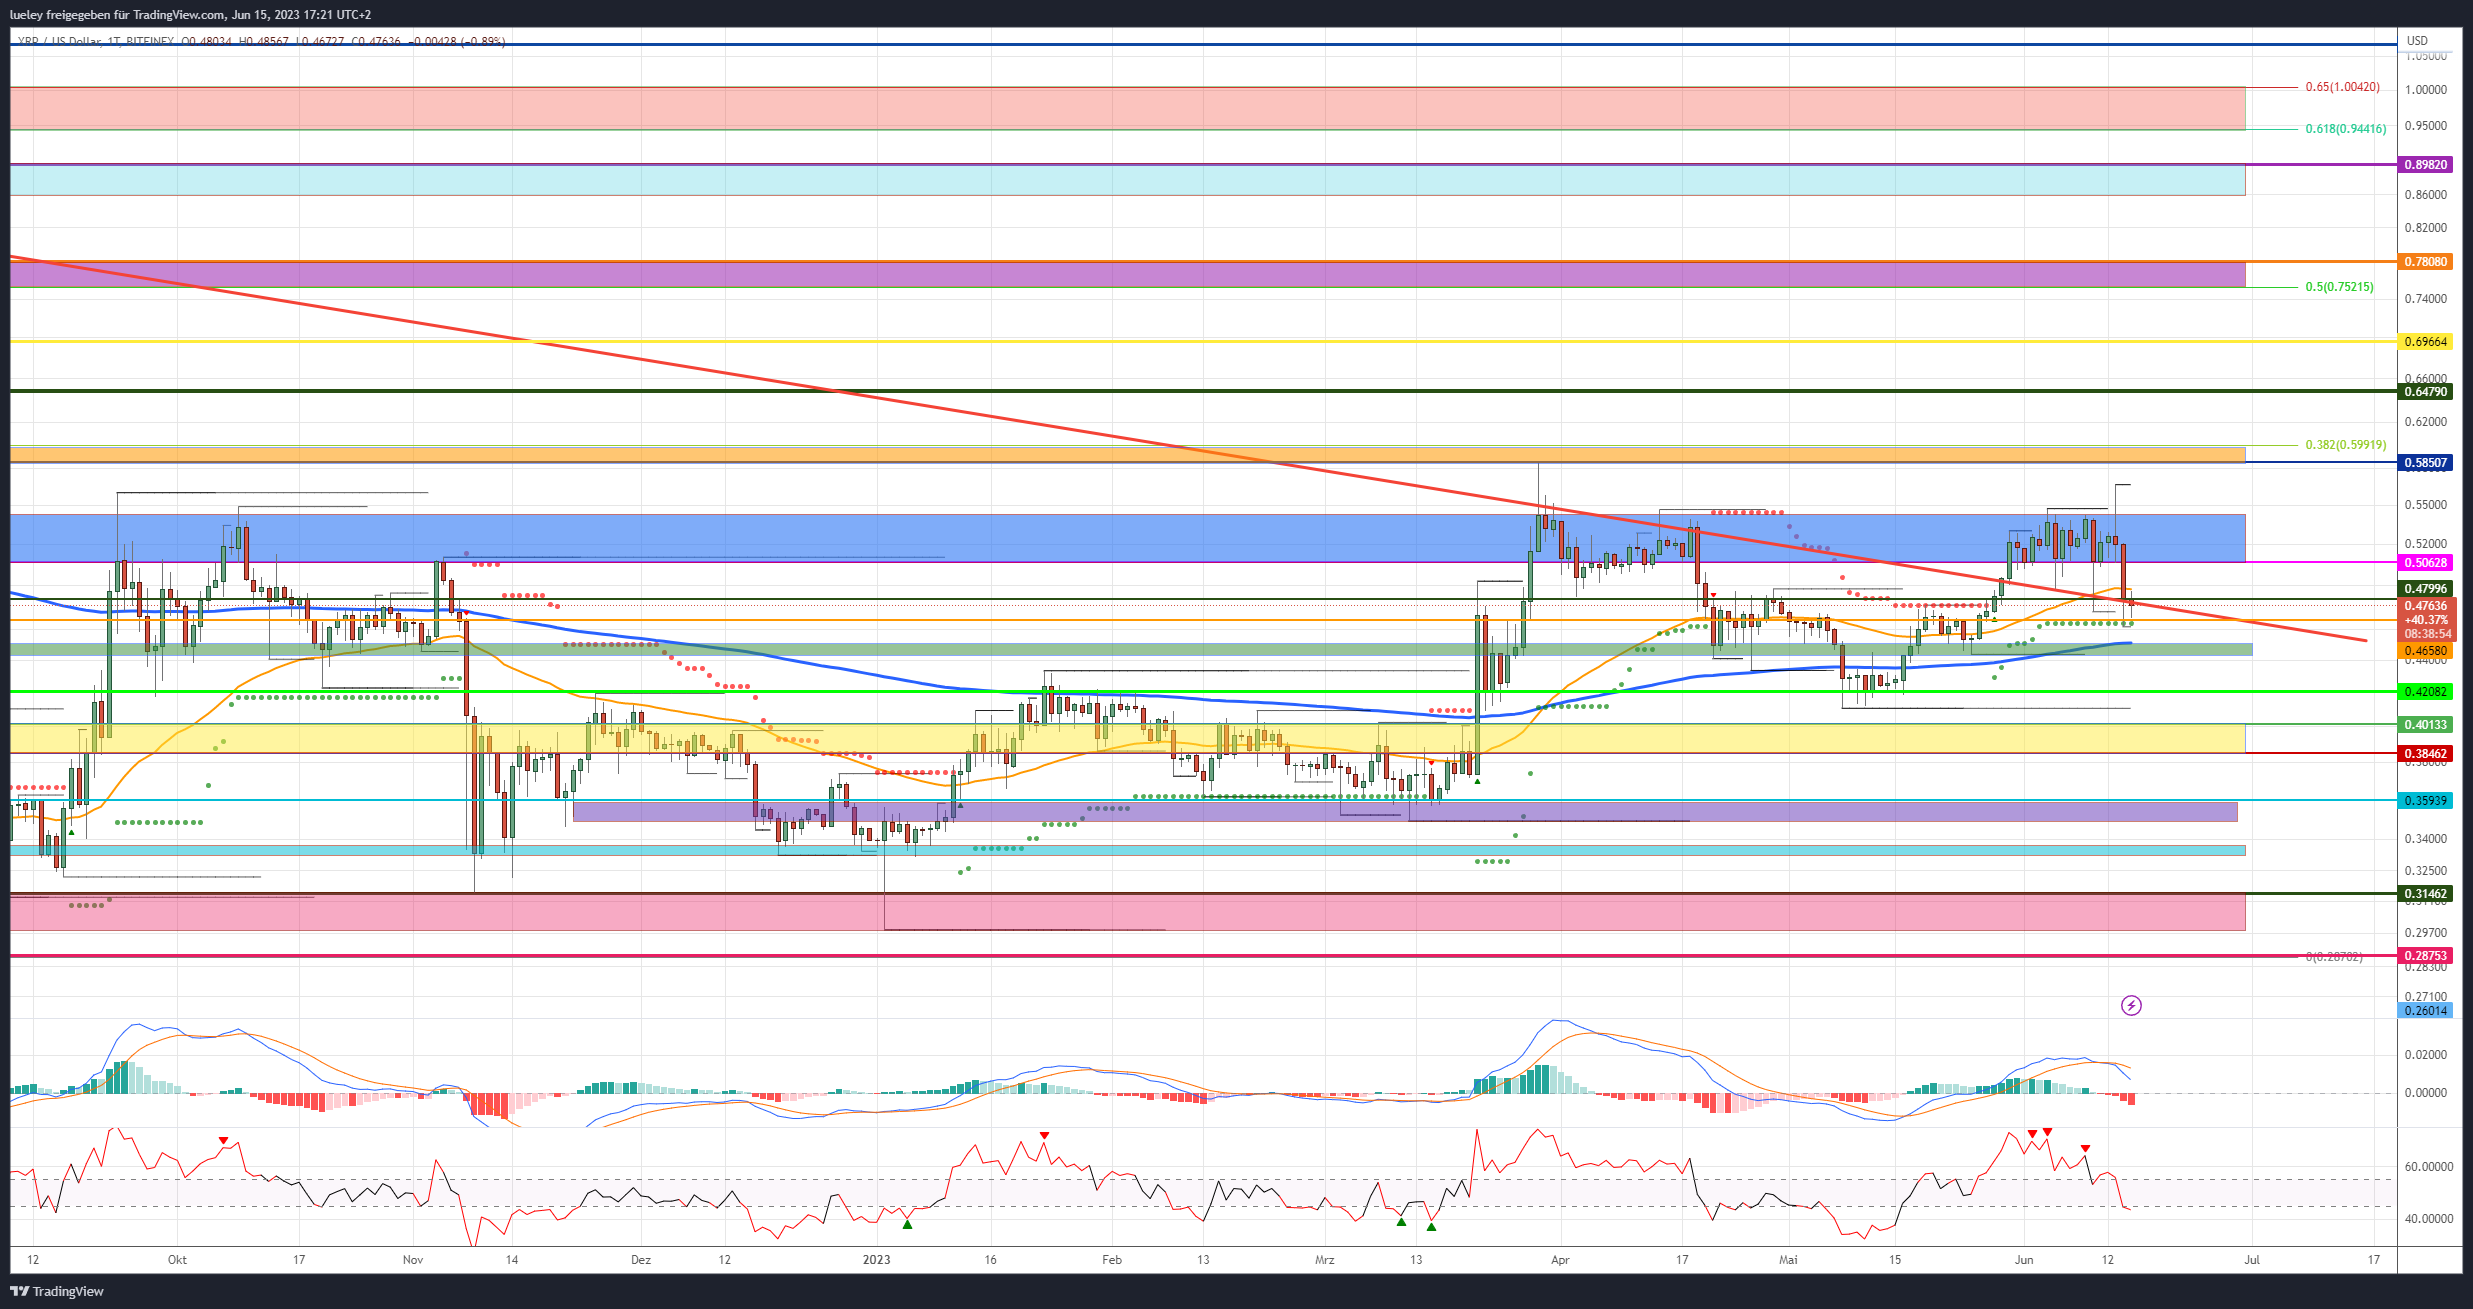
Ripple: Bullish price targets for the next few weeks
Bullish price targets: $0.506, $0.542, $0.585/0.599, $0.648, $0.696, $0.752/0.780, $0.860/0.898, $0.944/1.004
If the bulls can stabilize the XRP price in the cross-support area at $0.480 and Ripple does not slip below the overriding trend line and the previous day’s low at the end of the day, a new attempt to rise towards $0.506 is conceivable. When this mark is overcome, the upper edge of the blue resist zone at 0.542 US dollars will come into focus again. If the bulls do not fail here again and overcome this price level by the end of the day, a follow-up movement above the weekly high in the direction of the orange resistance zone should be planned.
If the buyer side can carry out a liberation and dynamically break through the higher-level 38 Fibonacci retracement at US$ 0.599, the trend movement should gain further strength. Ripple could then stop at the high from May 2022 at $0.648 in the medium term, even reaching the horizontal resistance at $0.696. If this resist mark is also pulverized, the price increase will extend to the medium-term target of between US$ 0.752 and US$ 0.780. Increased profit-taking is to be expected here.
Only if this area can also be broken upwards sustainably could the XRP price continue to pick up speed towards its highs of the previous year between USD 0.860 and USD 0.898 in the long term. For this, however, the Bitcoin price would have to shake off its recent weakness and tend towards annual highs again. Only if Ripple can also recapture this overarching price target in the long term, from a technical point of view, a further price jump to the maximum derivable target zone between USD 0.944 and USD 1.002 can no longer be ruled out.
Ripple: Bearish price targets for the next few weeks
Bearish price targets: $0.466, $0.450/0.442, $0.420, $0.401/0.384, $0.359, $0.348, $0.33, $0.314/0.287
So far, the bears have been able to avert the bullish breakout. If the XRP price falls back below the weekly low of $0.466 in a timely manner, the green support zone between $0.450 and $0.442 around the EMA200 (blue) will come into focus again. In order to generate sustainable selling momentum, the bears have to push the price below the green area in the long term.
Then the chances of a correction extension towards the previous month’s low increase. A medium-term directional decision is to be expected here. As a result, Ripple is likely to drop to the support zone between $0.401 and $0.384. A break of this area would result in a sell-off towards the March lows of $0.359.
The medium-term bearish target area would thus be reached. Should the bears manage to break through this area in the course of a sustained overall market weakness in the coming months, the XRP price will extend its downward movement directly into the purple support zone. To stave off a sell-off back towards the yearly lows, the bulls need to counter at $0.348. A task in this area would further cloud the chart picture. Ripple should then push through into the area around its key last 12-month supports between $0.314 and $0.287.
Looking at the indicators
Both indicators, RSI and MACD, are now showing sell signals on the daily chart. The RSI in particular threatens to leave the neutral zone to the south. In the weekly chart, the RSI has also dived back into the neutral zone and has negated its buy signal for the time being. In view of the general situation in the crypto market, this is not a good starting point for the bulls.
Disclaimer: The price estimates presented on this page do not represent buy or sell recommendations. They are merely an assessment by the analyst.
The chart images were created using TradingView created.
USD/EUR exchange rate at the time of going to press: EUR 0.92.
The latest issues of BTC-ECHO Magazine
You might also be interested in this