Bitcoin (BTC) suffers a sharp drop in price after a bullish week before. Within a day, an entire month’s rise was pulverized.
Bitcoin (BTC): Consolidation or next price jump?
BTC course: 45,846 USD (previous week: 50,022 USD)
Resistance / goals: $ 47,070, $ 48,222, $ 50,325, $ 51,307, $ 53,005, $ 54,077, $ 55,817, $ 57,998, $ 59,470, $ 61,771, $ 64,896, $ 67,416, $ 69,660, $ 70,856, $ 76,472, $ 77,678
Supports: $ 46,009, $ 44,878, $ 44,147, $ 42,923, $ 41,321, $ 40,585, $ 39,240, $ 38,537, $ 37,321, $ 36,643, $ 34,899, $ 33,335, $ 32,718, $ 31,603, $ 31,010, $ 30,000, $ 29,300 , $ 28,795, $ 27,563, $ 26,404, $ 23,887, $ 22,222, $ 21,892, $ 19,884,
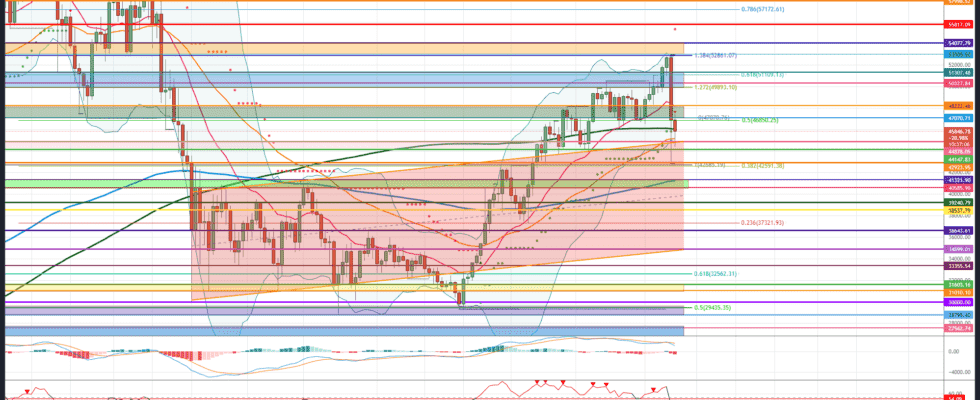
After the Bitcoin price rose to the lower edge of the orange resistance area at USD 53,005 yesterday, Tuesday morning of September 7th, the crypto reserve currency sold off significantly in the early afternoon. At its peak, the BTC price fell more than 21 percentage points to the support at USD 42,923. This also caused an intermittent bloodbath on the market as a whole. One of the reasons for the crash is, in addition to the clear long overhang on the futures market for leveraged Bitcoin products, the bumpy start of Bitcoin as a means of payment in El Salvador. When the Chivo wallet was introduced, there was a system crash due to the high demand. The Bitcoin price is currently recovering, but at USD 45,846 it is now trading again below the green resistance zone between USD 47,070 and USD 48,222.
Bullish scenario (Bitcoin price)
The bulls were able to stop the significant price correction at USD 42,923, but the sell-off pulverized the rise of a whole month. This sale shows again that you should never be too sure about the crypto market. Out of nowhere, the price collapsed by more than 21 percent and caused crocodile tears, especially among investors in the derivatives market. A total of around USD 4 billion in leveraged long products were liquidated. The vast majority of altcoins were hit even harder, and they have now lost 40 or more percentage points in value.
Although the BTC price was able to recover by more than eight percentage points to currently USD 45,846 in the last hours of trading, Bitcoin now has to overcome strong resistance levels again. Only when the bulls can move the key crypto currency back above USD 47,070 and in particular the EMA20 (red) at USD 48,222 at the daily closing price, the resistance zone between USD 50,325 and USD 51,307 will come into focus again. If the blue resistance area succeeds again, a new directional decision will be made at USD 53,005.
The way towards the all-time high
Above this resistance there would initially be room to USD 54,077, which would also brighten the chart image more clearly. If the daily closing price of USD 54,077 is also left behind, a follow-up increase to the next target price of USD 55,817 should be planned for. This chart mark was increasingly competitive in the past. If Bitcoin shows no renewed signs of weakness and breaks the USD 55,817, the overriding price target is activated at USD 57,998. The first profit-taking should start again here. Only when Bitcoin can sustainably overcome this resistance level will the old high of 59,470 USD move into the focus of investors.
If a breakout above this price level succeeds, an increase up to USD 61,771 is initially conceivable. In the medium term, an increase to the all-time high of 64,896 US dollars is also to be planned. If the bulls manage to break through the all-time high, the 138 Fibonacci extension at USD 67,416 will be the target. A stabilization above the USD 60,000 should lead Bitcoin towards the next target range between USD 69,660 and USD 70,856. If there is no significant price setback here either, the crypto key currency could target the maximum derivable target range between USD 76,472 and USD 77,678.
Bearish scenario (Bitcoin price)
The bears came back on the floor with a bang. The sale of some large investors led to a chain reaction in the derivatives market and noticeably dropped the price. If the seller’s warehouse succeeds in capping the BTC rate below the resistance area between USD 47,070 and USD 48,222 in the coming trading days, the area around USD 46,009 will come back into focus. Here you can find the MA200 (green) and the supertrend. A daily close below $ 46,009 suggests a retest of the support at $ 44,147.
The EMA50 (orange) and the lower Bollinger band currently run here. If this support level is permanently abandoned, there is a risk of another relapse to at least USD 42,923. If the bulls do not come back into the market here, a correction expansion into the green support zone between USD 41,334 and USD 40,585 should be planned. The EMA200 (blue) is currently also running here. If the Bitcoin price breaks through this strong support as well, a fallback to at least USD 39,240 is conceivable. A direct sale up to USD 38,537 is not excluded.
The correction is gaining momentum below $ 38,537
If this support is also given up at the closing price of the day, the downward momentum gains additional momentum. A fallback to the 23rd Fibonacci retracement at 37,321 should be planned. Should this support also be abandoned without resistance from the bulls, the correction will expand to USD 36,643. Persistent weakness activates further bearish price targets at USD 34,899 and USD 33,355. Here is the 61 Fibonacci retracement, which is a strong support. If this support is also given up on a sustained basis, a relapse to USD 31,603 is likely.
If the Bitcoin price breaks this support as well, the downward movement expands towards the maximum bearish target area between USD 31,010 and USD 30,000. For the time being, this course low in the purple support area represents the maximum price target on the underside. As long as the low of June 22nd at USD 28,795 is not abandoned, price targets at USD 26,399 or below are illusory for the time being. This week as well, as long as Bitcoin stabilizes above USD 42,923, the bulls will continue to have an advantage for the time being.
Bitcoin dominance: ricochet off the downtrend line
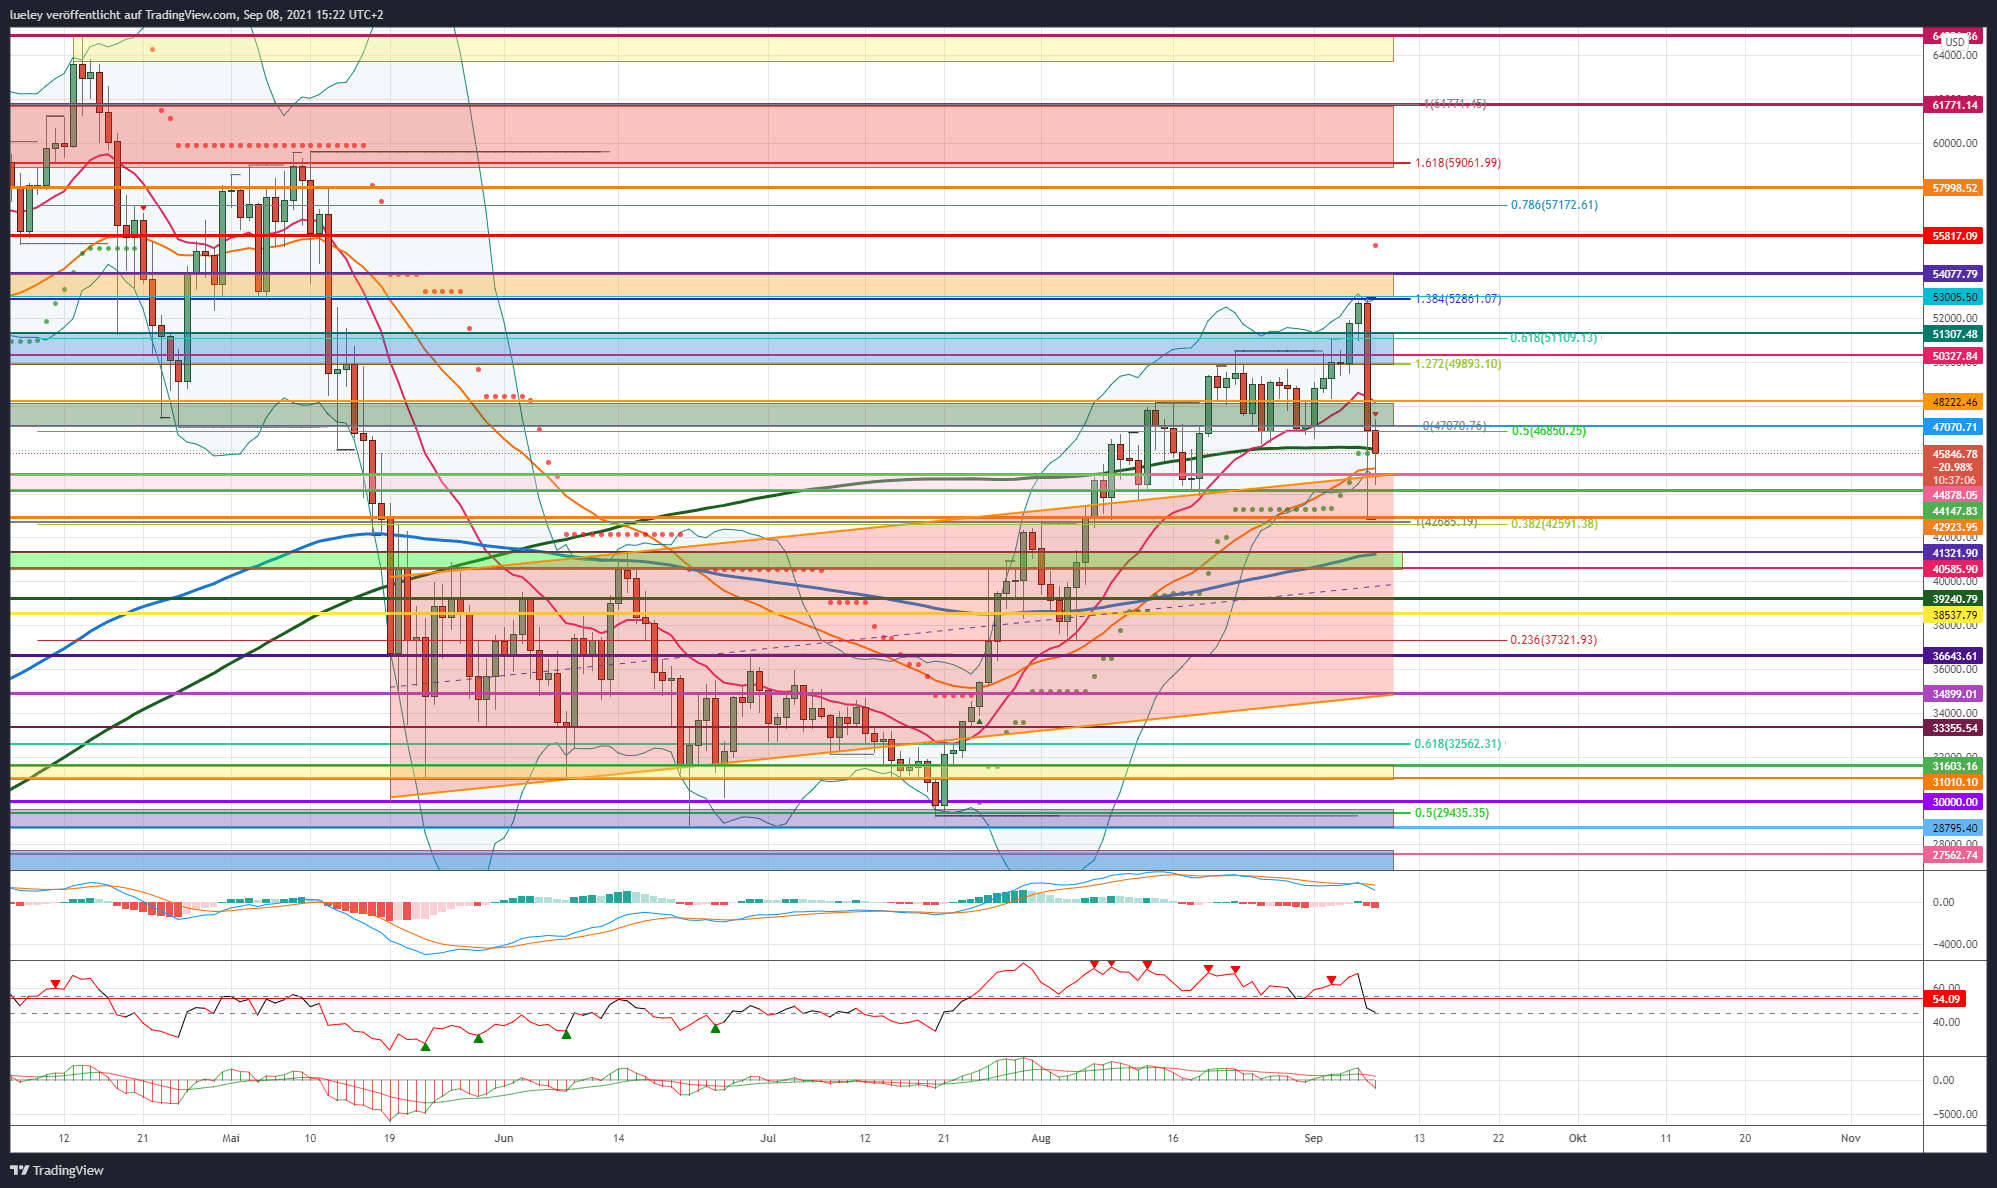
As expected, the Bitcoin dominance fell to the horizontal support at 41.22 percentage points, but was able to defend this support several times at the daily closing price. Due to the sharp drop in the price of all crypto currencies on Tuesday, September 7th, there was a significant price swing northwards. At its peak, the BTC dominance touched the bottom edge of the red box at 43.68 percent, before falling again to 41.91 percent. Currently, the dominance of the crypto reserve currency at 41.83 percent is not far from the resistance level at 42.27 percent. It can be stated that the support has held at 41.22 percent for the time being, and the BTC dominance is thus at the previous week’s level. However, as long as the Bitcoin dominance cannot generate stabilization above the EMA20 (red), there is still a potential for relapse.
BTC Dominance: Bullish Scenario
Yesterday’s sell-off across the entire crypto market ensured that some investors switched from Altcoins back to Bitcoin. In an initial reaction, this had a positive effect on its market dominance. If the BTC dominance succeeds in closing the day’s closing price above 42.27 percent, a subsequent increase in the range of 43.05 percent is likely. This is where the first relevant cross resistance from the horizontal resistance line and the EMA20 can be found. If this zone can also be recaptured in the long term and thus the red downward trend line can be overcome, an increase back to yesterday’s daily high of 43.68 percent should be planned. A subsequent increase back into the red box activates the next price target at 44.54 percentage points. In addition to the EMA50 (orange), the supertrend is also running in this area. Bitcoin dominance has not been able to regain this chart level at the daily closing price since August 19.
The way towards the psychological 50 percent mark
If there is a march through this resistance level, the upper edge of the red box comes into focus at 45.10 percent. If there is a breakout above this price level, resistance at 45.71 percent and 46.33 percent will come into focus again. The upper Bollinger band can currently be found here. If the BTC dominance can stabilize above 46.33 percent without significant setbacks, a subsequent increase of up to 47.03 percent and 47.59 percent is conceivable. At the latest at 47.59 percent, another relapse is to be planned. If, on the other hand, the BTC dominance succeeds in overcoming this strong resist, a march through to the orange resistance zone is conceivable.
The 48.67 percent is particularly important. A breakout above 48.67 percent brings the trend high from July 2021 at 49.26 percentage points into focus. The EMA200 (blue) and not far above the MA200 (green) also run here. Again a setback is to be expected. Only when these moving average lines can be overcome sustainably, the market power of Bitcoin is likely to increase again and start back above the 50 percent mark in the direction of 50.97 percent.
BTC Dominance: Bearish Scenario
The BTC dominance failed to break the support at 41.22 percent per day’s closing price for four days in a row. As long as Bitcoin’s market share cannot stabilize back above 43.05 percent, the chance of a renewed consistency test of 41.22 percent still prevails. Should Bitcoin’s market power drop below 41.22 percent and also give up the previous week’s low of 40.66 percent, a correction widening to the 40 percent mark is likely. If the Bitcoin dominance does not turn significantly back north, the annual low of 39.66 percent moves into the focus of investors. If there is a lasting break in this support, a correction expansion into the green support zone between 39.21 percent and 37.67 percent should be planned. Should the 37.67 percentage points be abandoned in the coming weeks, a correction towards the psychologically important 30 percent mark is even conceivable by the end of the year.
Disclaimer: The price estimates presented on this page do not constitute buy or sell recommendations. They are only an assessment of the analyst.
The chart images were created using TradingView created.
USD / EUR exchange rate at the time of going to press: 0.84 euros.