
Bitcoin (BTC) price is showing clear signs that it has finalized its correction and is now approaching its closest resistance zone.
Bitcoin’s price rose significantly during the week of December 19-26, closing at $ 50,775. This created a bullish recovery Japanese candlestick within the weekly data. This is a type of candlestick in which all of the previous decline is canceled out by a new weekly rise.
The last two times this happened (shown in the graph below), the price of BTC rose 49% and 40% respectively.
Despite this increase, technical indicators still show mixed prospects.
The MACD, which is created by short and long term moving averages (MA), is in gradual decline. This means that the short-term MA loses its speed compared to the long-term one. That said, it remains positive, indicating that short-term MA is still the fastest.
The RSI, a momentum indicator, sits right at the 50 line. This is a sign of a neutral trend, as values above 50 are considered bullish, while those below. below this point are considered bearish.
That said, this indicator has generated a hidden bullish divergence, which is a strong sign of a continuation of the trend.
The current breakthrough of BTC
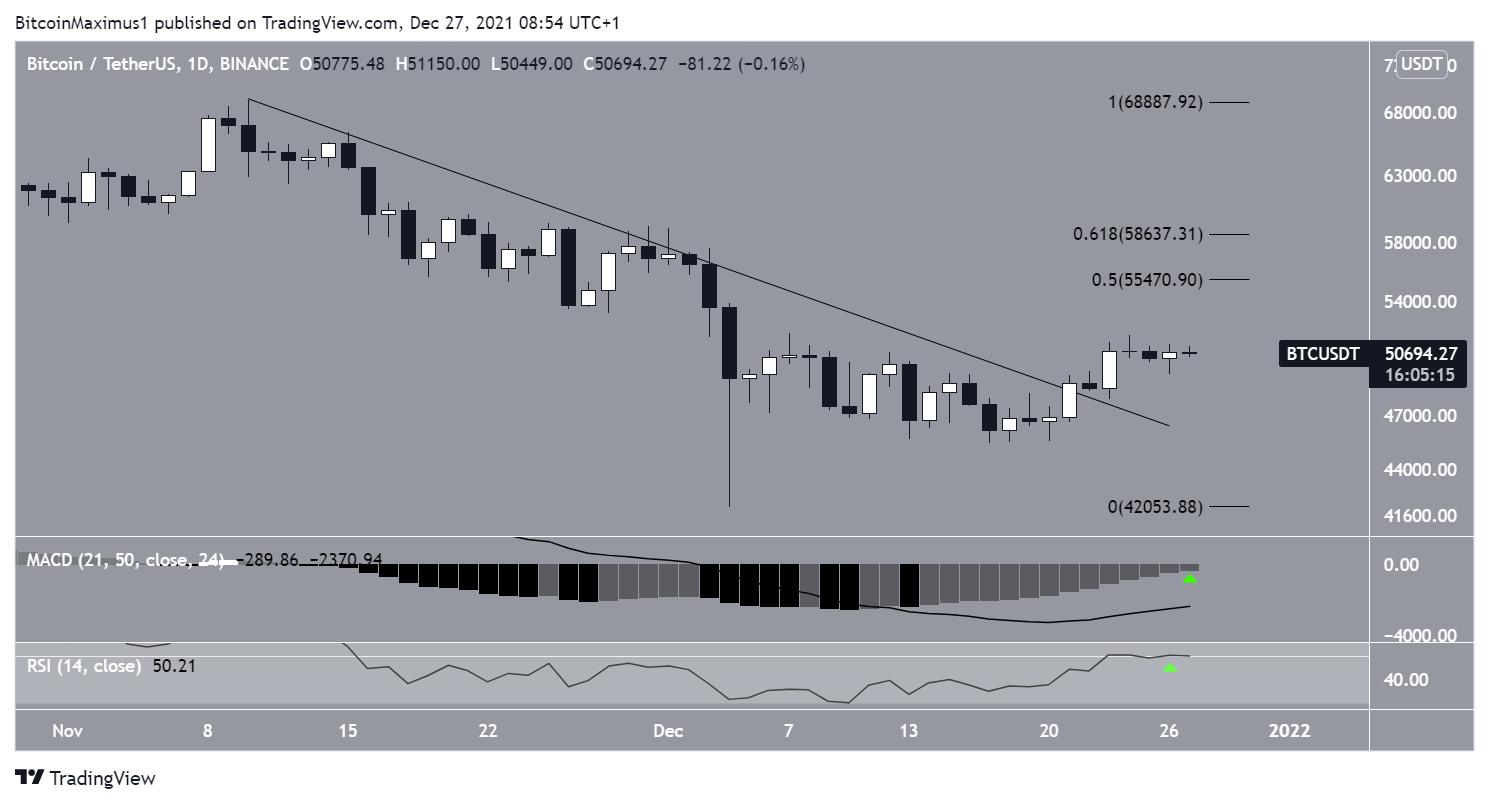
The daily chart shows that BTC broke a downward resistance line in place from the all-time high on November 8. This suggests that the correction has come to an end.
Technical indicators also seem bullish.
The MACD histogram has created 13 successive upper momentum bars, and is found almost positive. In addition, the RSI is about to rise above 50 (green arrows). Both of these are considered signs of an uptrend.
Thus, the daily chart presents a more clearly bullish daily outlook compared to the weekly chart.
The closest resistance zone is between $ 55,470 and $ 58,640, being created by the resistance levels of the 0.5-0.618 Fibonacci retracements.
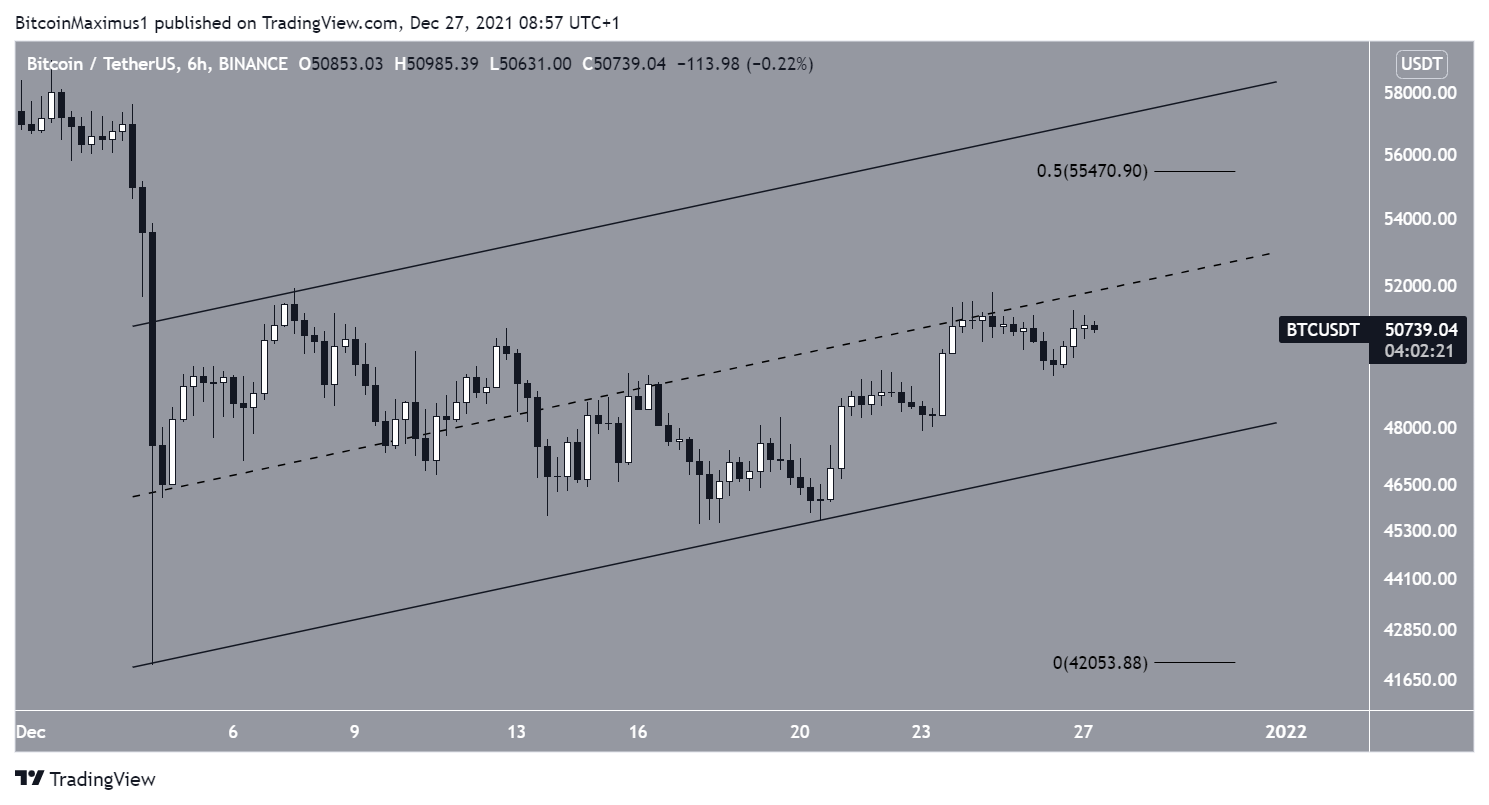
The six-hour chart shows that BTC is potentially trading within an ascending parallel channel from the December 4th low. It is currently located at the midline of this canal.
The resistance line of the channel is near the 0.5 Fibonacci level, not far from $ 55,000.
Course wave count
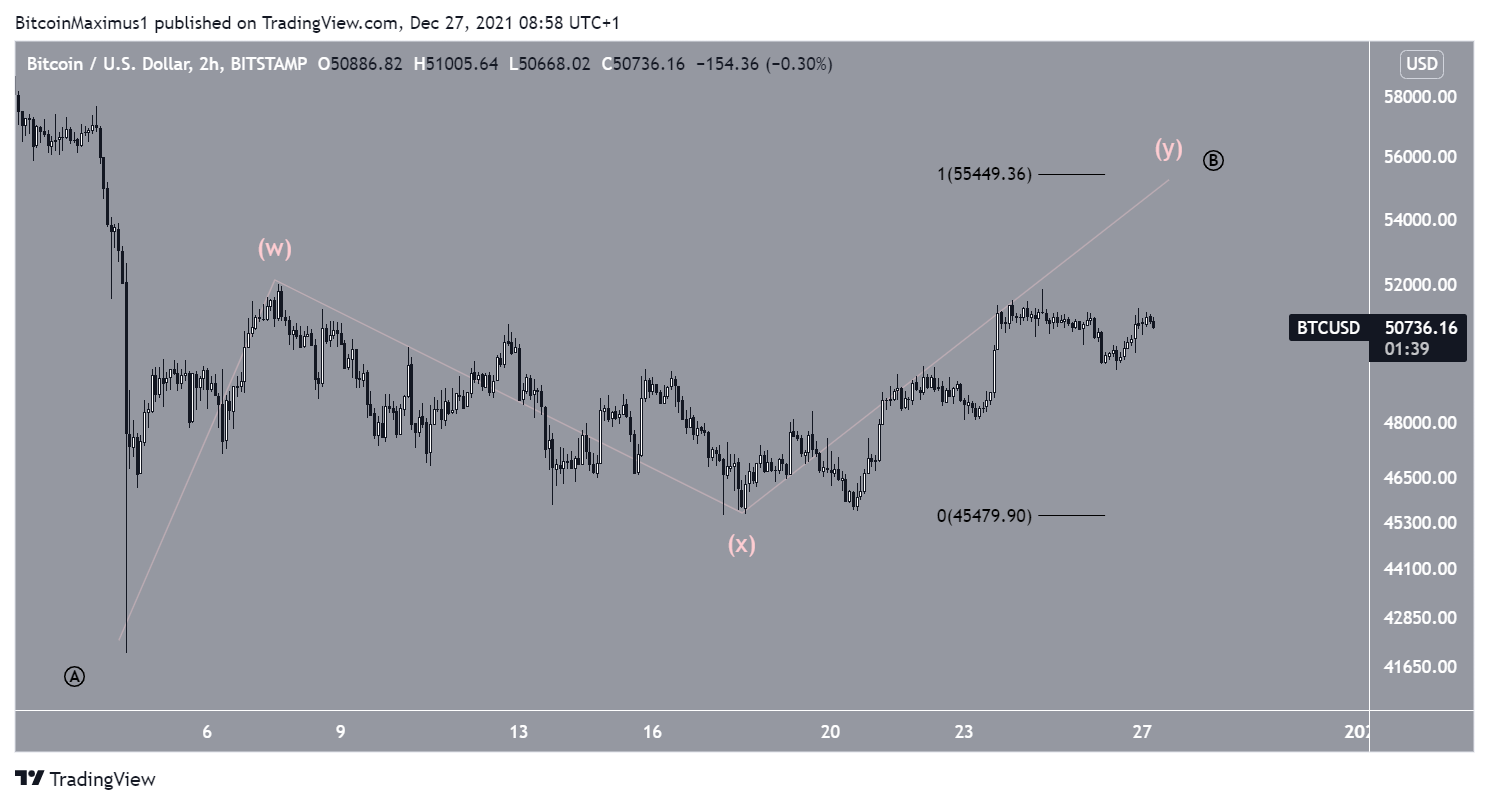
The wave count suggests that Bitcoin is in wave Y of a corrective structure in WXY (in pink). If W and Y waves show a 1: 1 ratio, BTC could climb to a high of $ 55,450, not far from the aforementioned resistance zone. This whole movement would probably complete a longer term B wave (in black).
If BTC were to break through this zone, it would go a long way in confirming that the long term trend is bullish, and that the current upward movement is not just part of a longer correction.
Disclaimer
All information on our website is published in good faith and for general information purposes only. Any action taken by the reader based on the information found on our website is entirely at their own risk.