While the crypto key currency Bitcoin (BTC) is still unable to stabilize sustainably above USD 60,000, the vast majority of Altcoins are rising steadily further north. Due to a possible success against the SEC lawsuit, Ripple (XRP) can gain significantly in value and soar to a multi-year high.
Many top 100 altcoins are showing double-digit price increases this week. Investors appear to be taking advantage of Bitcoin’s (BTC) s lingering breather for sustained altcoin investments. The investors rotate through the top 100 and always lead new crypto currencies to significant price increases. The best example is this week’s weekly winner. The Bitcoin derivative Bitcoin Gold (BTG) shoots up by more than 180 percent, while the crypto reserve currency Bitcoin itself only gained around 5 percentage points. Despite all the euphoria and bullish sentiment on the altcoin market, such a price increase in Bitcoin Gold must be a warning to caution. Such carelessness when investing in dubious crypto projects was also observed in previous, more pronounced market corrections.
Best price development among the top 10 altcoins:
Ripple (XRP)
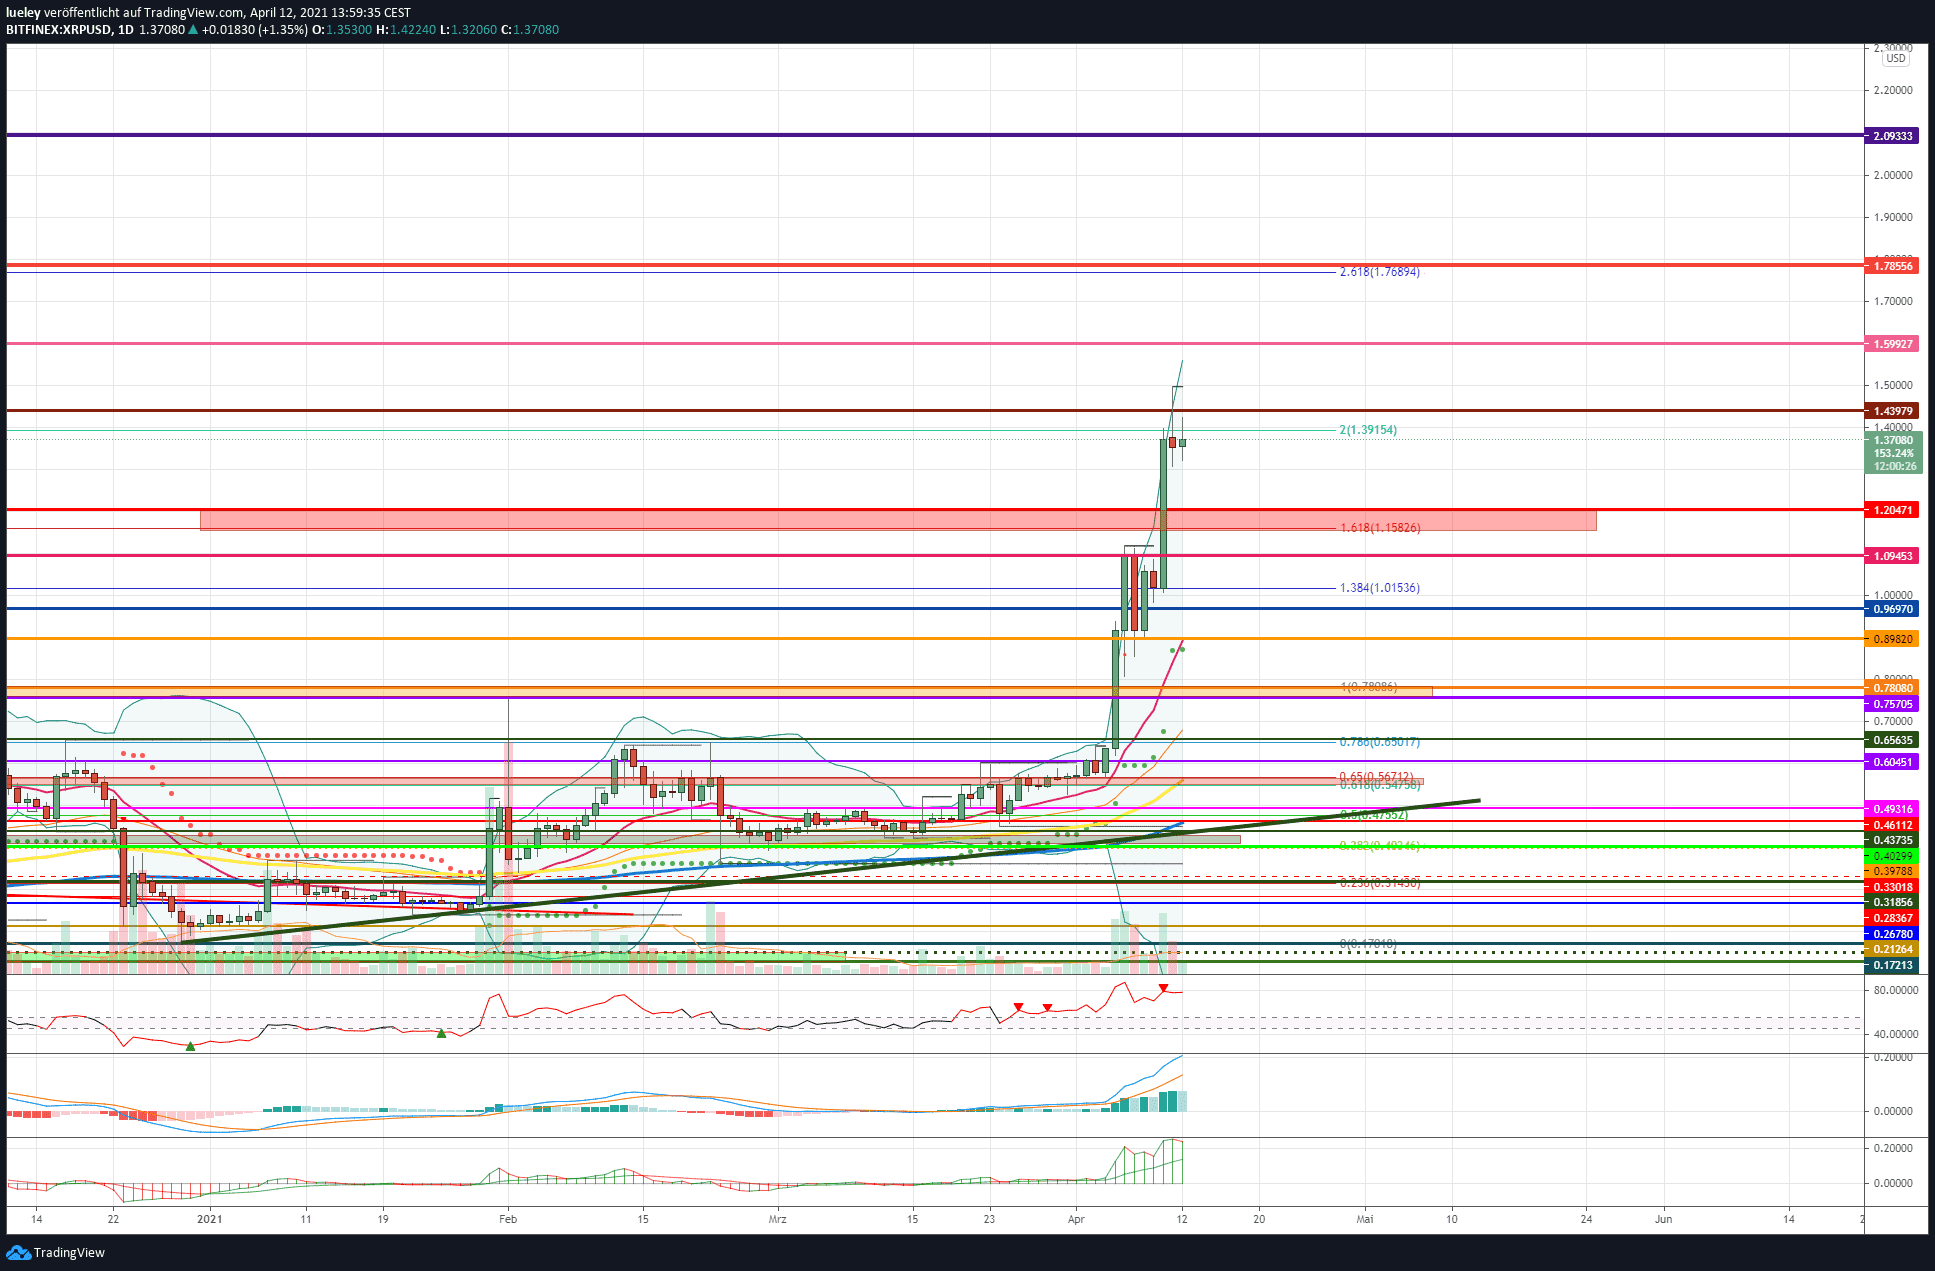
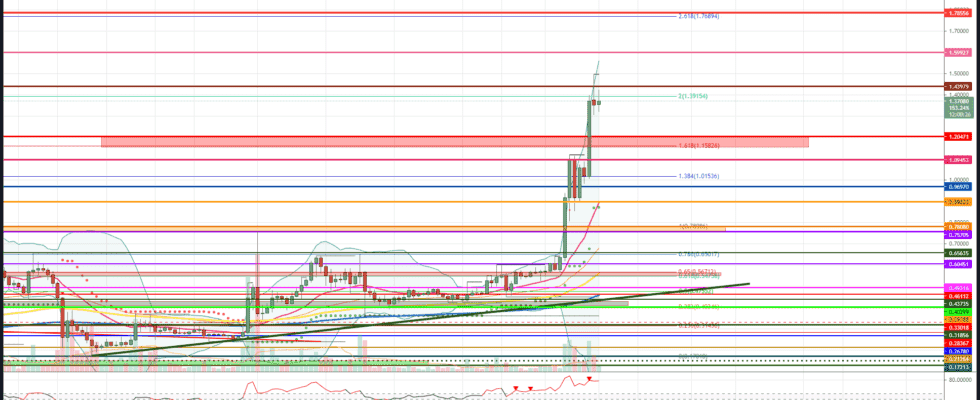
Price analysis based on the value pair XRP / USD on Bitfinex
The price of Ripple has already gained significantly in value recently and can gain significantly in value as a result of a partial success at the last SEC hearing this week. The XRP price shoots north by almost 120 percent compared to the week and can thus generate a three-year high. Investors are confident that the SEC lawsuit against Ripple is likely to be thrown out.
Bullish variant (Ripple)
The XRP price rose this week to a new high of 1.49 USD and thus easily reached the overall price target of 1.43 USD. Now it is up to the bulls to stabilize the price above USD 1.09, preferably even north of the support at USD 1.20. If it succeeds in breaking through the resistance at USD 1.43 per day’s closing price, the next price target is activated at USD 1.59. If this resist is also broken dynamically, the chart will clear up in favor of bullish investors. Then the 261 Fibonacci extension at 1.77 USD comes into focus. A strong horizontal resistance from 2018 also runs along this cross resistance.
display
Trade Bitcoin, Ethereum, Ripple, IOTA in one app!
Reliable, simple, innovative – trade Germany’s most popular cryptocurrencies easily and securely.
The advantages:
☑ Free 40.0000 EUR demo account
☑ Registration in just a few minutes
☑ PayPal deposit / withdrawal possible
☑ Available 24/7 + mobile trading
To the provider
76.4% of retail investor accounts lose money when trading CFDs with this provider [Anzeige].
If there is no significant profit-taking in this area, a march towards USD 2.09 is also conceivable in the medium term. Only when this resistance level is surpassed in the long term will further bullish price targets be activated at USD 2.37 (361 Fibonacci extension) and USD 2.75 (423 Fibonacci extension). At the latest at the USD 2.75 mark, investors will increasingly want to take profits, as this price mark represents a strong resistance from the first week of January 2018. The XRP price could reach a maximum of USD 2.99 in the short term, the maximum medium-term price target increase. Here you can find the 461 Fibonacci extension, which often acts as a strong resistance in the crypto area.
Bearish variant (ripple)
If, on the other hand, Ripple does not overcome the resistance at USD 1.43, but rebounds more significantly south, the support areas at USD 1.20 and USD 1.09 will initially come back into focus. Only when the bears manage to dynamically break these two support levels will a relapse to $ 0.96 be anticipated. If the seller succeeds in pushing the XRP rate below this support level, a first directional decision will be made at USD 0.89. The EMA20 (red) and the supertrend in the daily chart run at this cross support. If this support is undercut, a retest of the last history high at USD 0.78 is likely. At the latest at this support bullish investors will dare to make new entries again.
On the other hand, if the bears manage to break this strong support at the daily closing price, the XRP price will correct immediately up to USD 0.65. Also, a relapse to the breakout level at USD 0.60 would not be surprising. If the downward momentum continues to gain momentum, the multiple support between USD 0.56 and USD 0.54 moves into the focus of investors. Here you can find the Fibonacci 61 retracement and the EMA100 (yellow). If no new investors come into the market in this chart area and Ripple continues to slide, new bearish price targets are activated at USD 0.49 and a maximum of USD 0.46. The EMA200 (blue) is currently running at USD 0.46, as is the overriding green upward trend line just below it. At the latest at this support level, bullish investors will re-enter and move the course towards the north again.
Indicators (Ripple)
The RSI indicator as well as the MACD indicator continue to have a buy signal active on a daily basis. The weekly chart also shows a similar picture. Both indicators show buy signals, which underpins the bullish scenario.
Worst price development among the top 10 altcoins:
Polkadot (DOT)
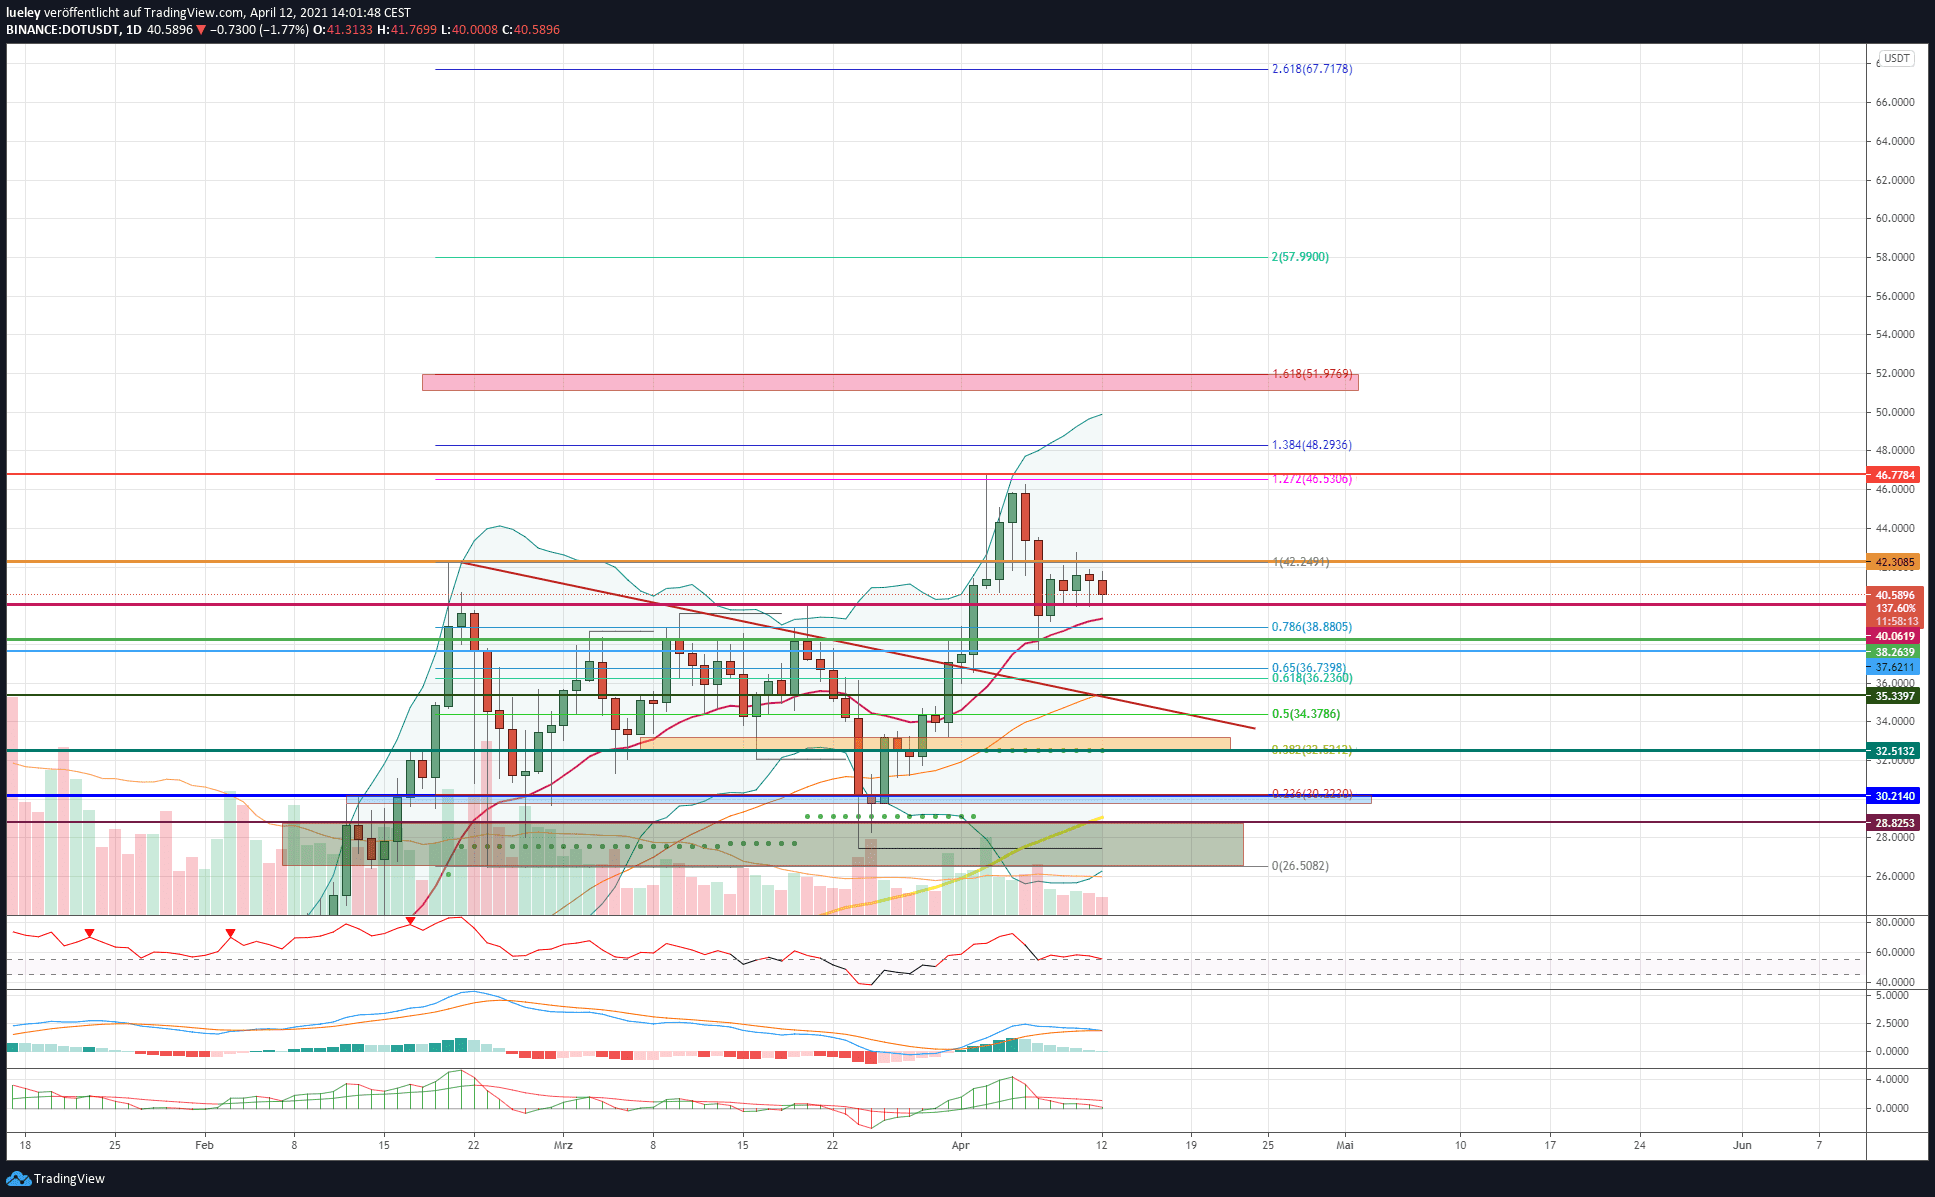
Price analysis based on the value pair DOT / USD on Binance
After a strong price increase in the last week of trading, which led the DOT price to a new all-time high at USD 46.80, Polkadot had to cope with increased profit-taking this week. The DOT rate fell back to the cross support level at USD 38.26 before the polkadot stabilized. The DOT price is currently trading at USD 40.49 and has missed recapturing the previous high of USD 42.30 in the last few days.
Bullish variant (polkadot)
As long as the Polkadot rate stabilizes above USD 40.06 and is thus further above the EMA20 (red), the view will remain upwards. If the price of Polkadot can regain USD 42.30 in a timely manner, another attempt to rise towards USD 46.50 should be planned. If the DOT price subsequently overcomes its all-time high above the 127 Fibonacci extension at USD 46.77 and also breaks out dynamically above the 138 Fibonacci extension at USD 48.29, it is a break through to the 161 Fibonacci extension imaginable at $ 51.97.
This chart mark represents the first short-term price target. If the bulls manage to break this projected resistance at the daily closing price, a subsequent rise to the USD 57.99 is likely. Here you can find the 200 Fibonacci extension of the current price movement. A sustained friendly mood on the crypto market should lead the DOT price to the 261 Fibonacci extension at USD 67.71 in the medium term. In the second half of the year, Polkadot could move further towards the 361 Fibonacci extension at $ 83.45. The maximum price target for this year remains unchanged at the am 461 Fibonacci extension at USD 99.19.
Bearish variant (polkadot)
On the other hand, if the correction at Polkadot continues to gain momentum and the DOT rate slips below the support at USD 40.06 at the end of the day, a relapse into the range between USD 38.26 and USD 38.80 should be planned. If the DOT price closes below the EMA20 (red), the chart will continue to cloud over for a short time. Polkadot will then consolidate to its weekly low of $ 37.62. If this support is also dynamically undershot, a relapse into the range between USD 36.73 and USD 36.23 is likely. This is where the 61’s Fibonacci retracement can be found. If the DOT rate continues to correct, a directional decision is made at USD 35.33. The EMA50 (orange) and the red downtrend line run here.
If the bears manage to push the price back below this support level, a price decline into the orange support area must first be planned. The 38 Fibonacci retracement and the supertrend in the daily chart are currently at USD 32.52. Therefore, strong resistance from bullish investors is to be expected at this support. If there is a widening of the correction on the market as a whole, the price could correct from Polkadot to the 23rd Fibonacci retracement. The USD 30 area has been a strong support several times in the recent past. However, a temporary relapse to around USD 28.82 cannot be ruled out. In addition to horizontal support, the EMA100 (yellow) also runs here. For the time being, this support level is to be seen as the maximum bearish price target.
Indicators (polkadot):
The RSI as well as the MACD indicator threaten to activate fresh sell signals again if the correction widened. However, as long as the RSI is between 55 and 45, it is in neutral territory. Only a break in the support area around USD 37.62 should generate a new short signal on the RSI.
Top 10 stability
With only two exceptions, all of the top 10 Altcoins recorded some considerable price increases in the past trading week. Ripple (XRP) can book the strongest price increase. The Binance Coin (BNB) also continues to rise significantly to the north, gaining 70 percent in value. Stellar (STR) is also bullish with a price increase of 41 percent. Furthermore, the crypto veteran Litecoin (LTC) can increase by 25 percent after recently weaker weeks. The two losers of the week are Polkadot (DOT) with a price drop of almost seven percent and Uniswap (UNI) with a good 2 percent price discount. The strong outperformance of Ripple and Stellar caused several changes in the ranking. XRP jumps two positions to fourth and relegates Polkadot (DOT) and Cardano (ADA) to their places. In addition, Litecoin overtook Uniswap to seventh place and Stellar ousted the Theta Token (THETA) from tenth place.
Winner and Loser of the Week
Investors are using the sustained sideways phase of the crypto key currency Bitcoin to continue investing in the altcoin market. The market has once again gained bullish momentum and helped 70 percent of the top 100 Altcoins to gain prices. The three outperformers of the week show three-digit price increases. With a price increase of more than 180 percent, Bitcoin Gold (BTG) tops the list of winners. KuCoin Token (KCS) are also strong with 170 percent and Ripple with 117 percent price increase. More than 30 percent of the top 100 altcoins also rises by more than 20 percentage points.
Among the almost 30 weekly losers, Holo (HOT) shows the largest weekly loss with 29 percent after sustained profit-taking. Two of the high flyers of the last few weeks, Dent (DENT) and Wink (WIN), also lose more than 27 percent after taking profits. The altcoin market remains strong overall and continues its bullish rally of recent months. However, investors should take into account that almost every crypto currency among the top 100 has already posted significant increases in value. First profit hedges are overriding and worth considering.
Disclaimer: The price estimates presented on this page do not constitute buy or sell recommendations. They are only an assessment of the analyst.
The chart images were created using TradingView created.
USD / EUR exchange rate at the time of going to press: 0.85 euros.
Learn crypto trading
The entry-level course for trading Bitcoin and digital currencies
3 hours video course with professional trader Robert Rother
Learn to trade now