The Bitcoin price is currently not moving and is still just below the psychological USD 60,000 mark. The crypto market capitalization, on the other hand, is tending to new all-time highs and has tripled in the last few months.
Bitcoin (BTC): Bitcoin course without a clear direction
- BTC course: 56,294 USD (previous week: 55,393 USD)
- Resistance / goals: $ 56,867, $ 58,386, $ 59,527, $ 61,122, $ 61,771, $ 64,896, $ 67,416, $ 69,744, $ 70,000, $ 70,856, $ 76,472, $ 77,678, $ 80,323, $ 86,295, $ 89,982, $ 100,258, $ 113,074
- Supports: $ 54,077, $ 53,005, $ 51,307 / $ 50,305, $ 49,423, $ 48,222, $ 47,070, $ 44,878, $ 43,030, $ 41,967, $ 40,240, $ 38,743
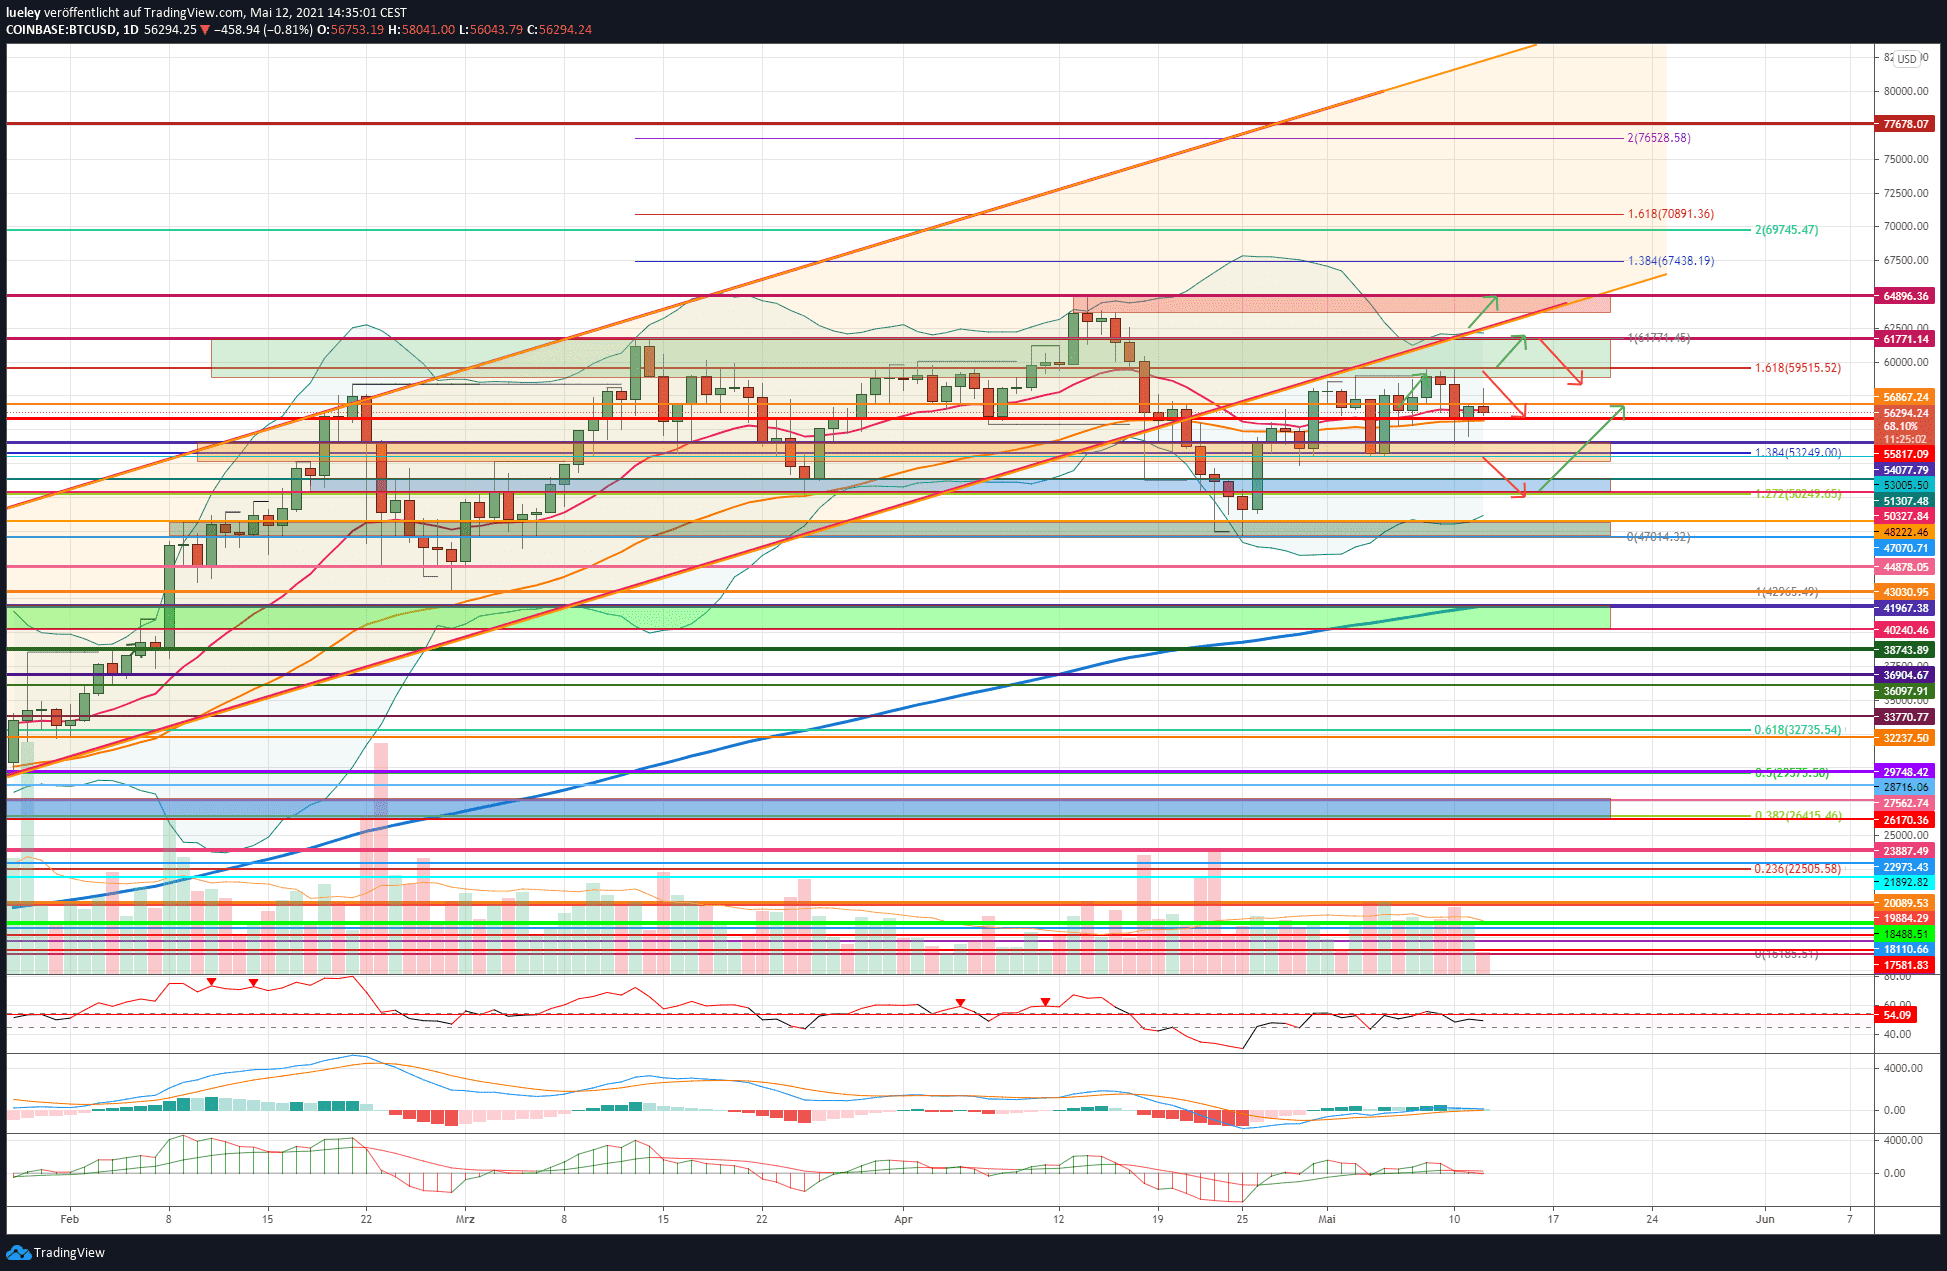
Price analysis based on the value pair BTC / USD on Coinbase
All attempts by the bull camp to move the crypto reserve currency Bitcoin back above USD 60,000 failed this week. However, since the bears also fail to push the BTC rate below the orange support zone, a new sideways range has recently formed. Only a resolution of this trading area should provide more clarity for investors.
Bullish scenario (Bitcoin price)
As long as Bitcoin does not break out dynamically above USD 59,514, the bulls have to keep calm. As noted in the previous week’s analysis, only a sustainable overcoming of this resistance level will be able to spark new upward potential. Then the history high at USD 61,771 would come into the focus of investors. If investors can subsequently break this price mark at the daily closing price, the chance of a march through to the all-time high of USD 64,896 increases noticeably. If the BTC price can stabilize in the area of the red resistance zone and jump back into the uptrend channel, this is an important bullish signal. Then the likelihood of a subsequent move in the direction of the 138 Fibonacci extension at USD 67,416 increases significantly. If the Bitcoin price overcomes this resistance, a directional decision between USD 69,744 and USD 70,856 can be expected. If Bitcoin breaks through the 161 Fibonacci extension of the current price movement as well as the 200 Fibonacci extension of the higher-level trading movement and leaves the USD 70,000 behind, a march through to the 200 Fibonacci extension of the current upward movement at USD 76,472 should be planned.
As a result, the next relevant target price at USD 77,678 would be within our grasp. This resistance level arises from the monthly chart and is therefore of high relevance. Short term profit taking is likely. As long as Bitcoin stabilizes sustainably above the psychological USD 70,000 mark, the next level of resistance at USD 80,323 will come into focus in the medium term. This also increases the prospect of reaching the 261 Fibonacci extension of the higher-level price movement in the second half of the year. That resistance is at $ 86,295. A march through to the 461 Fibonacci extension at USD 89,982 would also be conceivable. If there are no significant setbacks, a price increase of up to USD 100,258 is possible. The 361 Fibonacci extension of the current price movement runs at this price mark. If the BTC price stabilizes above the psychological USD 100,000, the maximum price target between USD 113,074 and USD 114,959 would even be achievable.
Bearish scenario (Bitcoin price)
The bears have been present for the last few days of trading as soon as the $ 59,515 hit. This averted a jump back over the 60,000 USD so far. For their part, however, the sellers did not manage to embarrass a new trend low. Only when the BTC rate drops below USD 54,077 at the end of the day and subsequently also below USD 53,005, lower prices become more likely again. If Bitcoin dynamically falls below the support at USD 53,005, the correction expands. Then the blue support area between USD 51,307 and USD 50,327 comes into focus. At USD 50,327, the bulls will try again to move the BTC rate north. Should Bitcoin break through this support zone on the other hand, a consolidation in the dark green support zone should be planned.
This runs between USD 48,222 and USD 47,070. If the BTC rate does not stabilize here, the correction extends towards USD 44,878. A persistent price weakness increases the chance of the price decline to the low of 43,030 USD. If the bulls give up this important support level, the correction extends to USD 41,967 and even USD 40,240. Furthermore, the green support zone is to be seen as the maximum bearish price target. In particular, the EMA200 (blue) at USD 41,967 acts as a strong support here. Only when the bears build up selling pressure across the board is a price drop to USD 38,743 conceivable. Neither the RSI nor the MACD indicator are currently delivering signals that justify such a sharp decline in prices.
Total market capitalization: uptrend in full swing
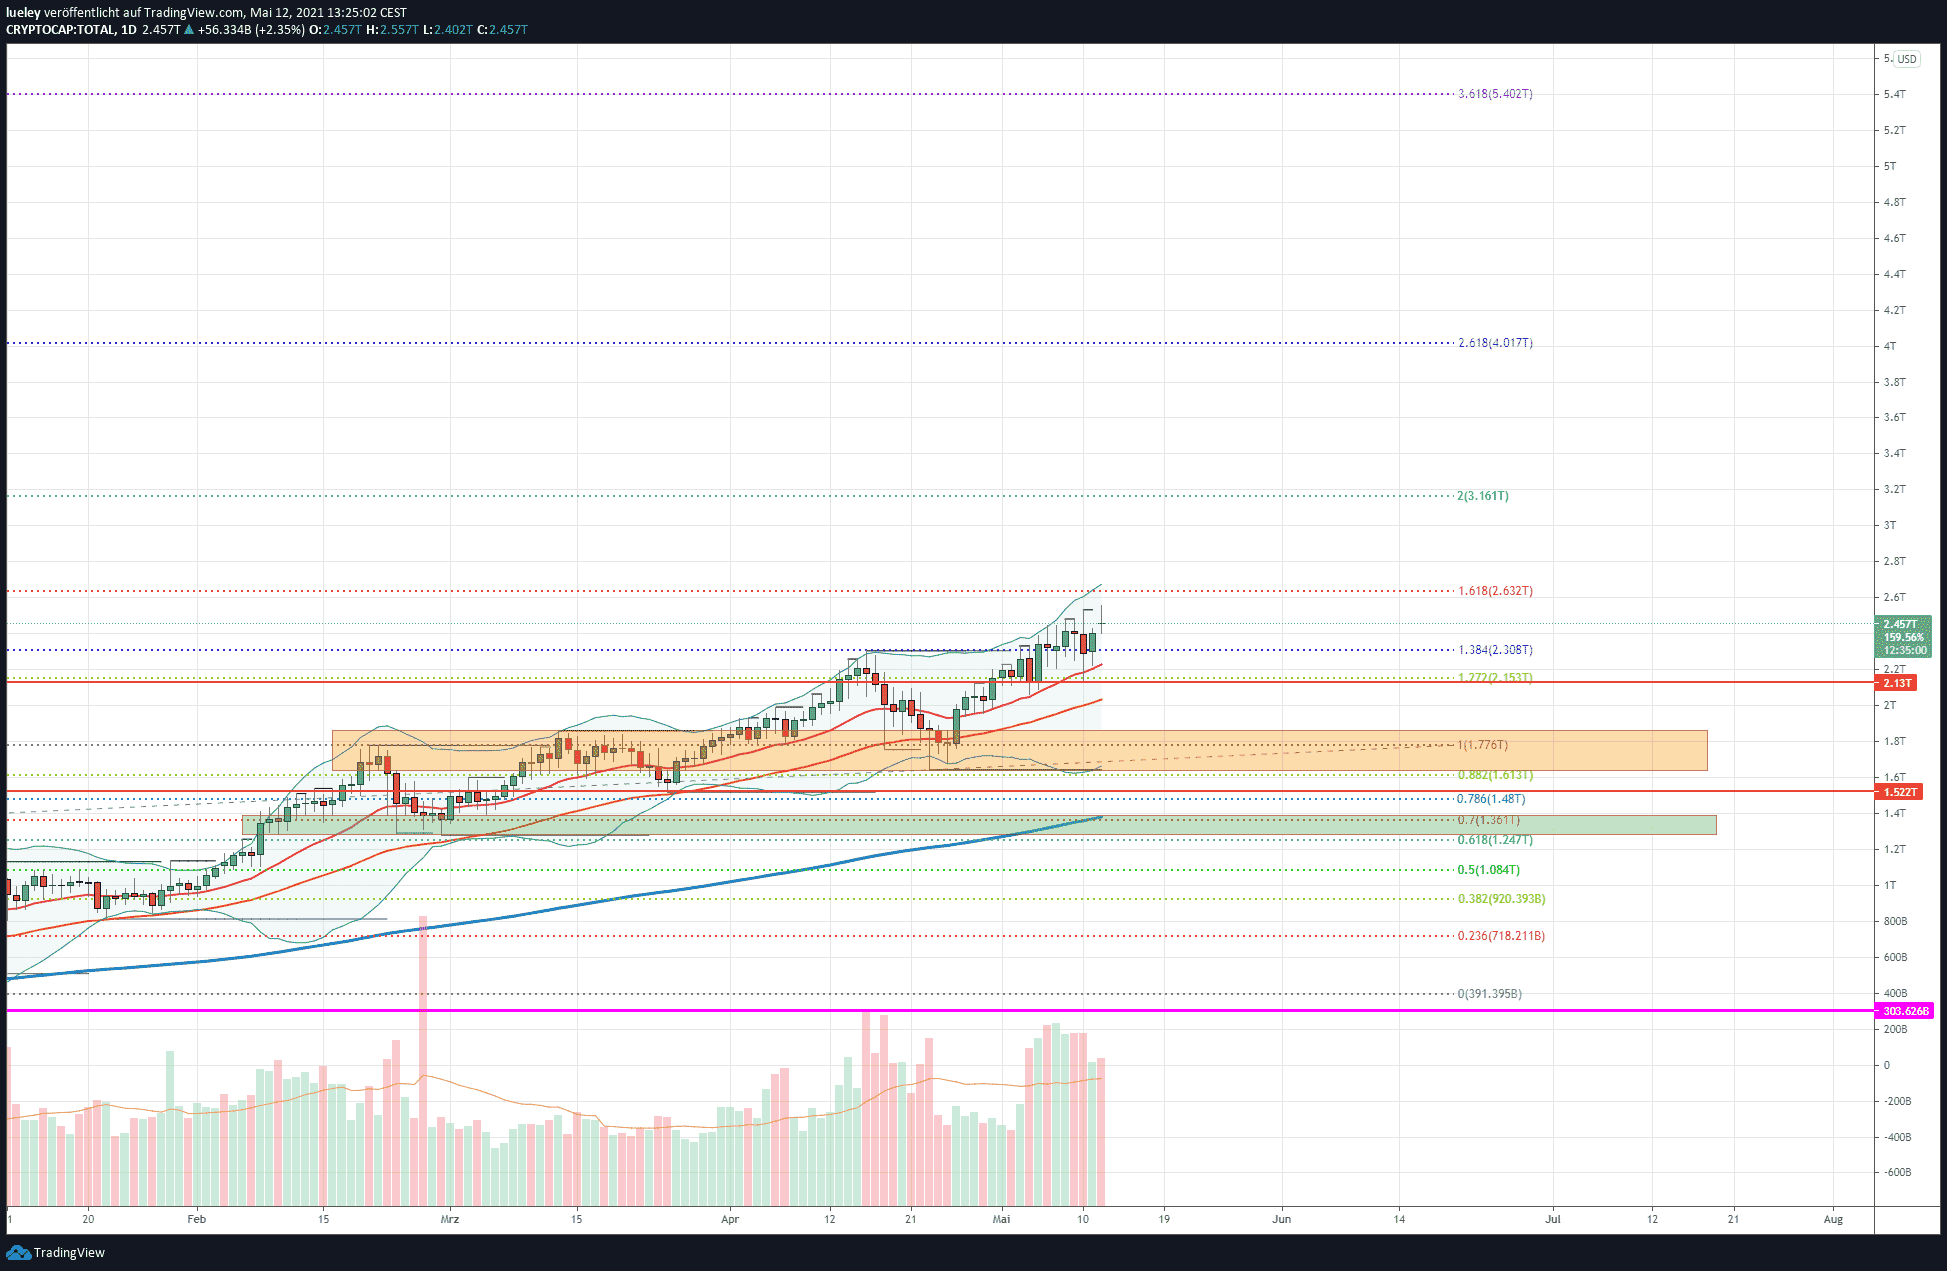
Total market capitalization based on values of Cryptocap shown
This week, instead of the Bitcoin dominance, which was already discussed in another article today, the total market capitalization will be examined in more detail. Since the beginning of this year, the market capitalization of the entire crypto market has skyrocketed by a remarkable 250 percent. It is currently USD 2.4 trillion, around 30 percent of the gold equivalent. The increasing coverage of crypto currencies in the global media impressively shows that the market is gradually growing up and has a permanent place in the financial market.
How do I buy Bitcoin? Guide and provider comparison 2021
We will explain to you quickly and easily how you can buy Bitcoin safely and cheaply and what you should pay attention to!
To the guide >>
Bullish scenario (total market capitalization)
Since the capitalization of the total market corrected significantly on April 23, there has been a brilliant bullish rally, which caused the total market to increase in volume by more than 50 percent within 20 days. Since December 2020, investors have repeatedly been able to parry sustained corrections under the EMA50 (orange). Most recently, the total market capitalization rebounded upwards at the EMA20 (red). This development underpins the tendency of the current upward trend. As long as the price can hold out above USD 2.15 trillion, the first target is USD 2.63 trillion. Here is the 161 Fibonacci extension of the current breakout movement since October 23, 2020.
If the market capitalization also overcomes the USD 2.63 trillion per week’s closing price, the USD 3.16 trillion target comes into focus. As long as Bitcoin does not sustainably slide below USD 40,000 and the prices of the Altcoins are gradually trending bullish, the price is likely to rise to the 261 Fibonacci extension at USD 4.01 trillion in the medium term. This brand is of great relevance. The entire crypto market would thus correspond to 50 percent of the global gold market. If further ETFs for the crypto currency Bitcoin and the number two Ethereum are launched in 2021, it is quite conceivable that the total market capitalization will even reach the 361 Fibonacci extension at USD 5.40 trillion in 2021.
Bearish scenario (total market capitalization)
In addition to all the positive reports about the development and increasing mass suitability of Bitcoin and Co., there are also critical aspects. The fact that altcoins such as Dogecoin (DOGE) have recorded a price increase of 10,000 percent in the last few months has raised eyebrows even among die-hard crypto enthusiasts. Even the parody of Dogecoin, the meme coin Shiba Inu (SHIB) recently listed on Binance, shot north by several thousand percent in the last few weeks of trading. Such tendencies could develop into a boomerang for the crypto sector, at least in the short term. Should the total market capitalization fall back below USD 2.13 trillion and also dynamically fall below the EMA50, a correction of up to USD 1.86 trillion can be expected.
The orange support area between USD 1.86 trillion and USD 1.63 trillion is currently the new base. If this area is broken down, the sales low at USD 1.52 trillion will first come into focus. If the correction should expand, especially for Altcoins, a relapse to the EMA200 (blue) cannot be ruled out. From today’s perspective, the green support zone between USD 1.38 trillion and USD 1.28 trillion is the maximum correction area. This correction would mean, as it were, a market adjustment, which would be welcome from a medium and long-term perspective. The carelessness of the investments of some inexperienced investors shows tendencies towards the market peak at the beginning of 2018. In order for the crypto sector to be given the urgently needed rating of seriousness by the entire financial market, a “wash-out” is required in the medium term. When and to what extent this correction will take place will be seen in the coming trading months.
Disclaimer: The price estimates presented on this page do not constitute buy or sell recommendations. They are only an assessment of the analyst.
The chart images were created using TradingView created.
USD / EUR exchange rate at the time of going to press: 0.84 euros.
display
Simply buy and sell CFDs on DOGE
DOGE / USD trading opportunities
The market is picking up – join us! Buy CFDs on Dogecoin today and benefit from tight spreads. Libertex offers unique market conditions for all of its traders.
Get started now >>