Bitcoin bends – Historically, Bitcoin had to face a phase of capitulation and then resume a bullish cycle. The market, with the help of more or less large rebounds, makes players believe that the cycle is not over, that there is still hope. This until a breaking point, where investors say to themselves that it is better to sell for buy bitcoin cheaper. It is often a major downward movement, in a tight timing, to play as much as possible on the emotions of market players. It is at this very moment that the market changes momentum. There are no more sellers, and the whales have taken all the Bitcoin. Of course, this is not a mechanism specific to cryptocurrencies, it is the functioning of financial markets. After 70% decline, has the market experienced this phase of capitulation or is it still only the beginning of a bearish cycle on cryptocurrencies?
This Bitcoin price analysis is brought to you in collaboration with the Coin Trading and its algorithmic trading solution finally accessible to individuals.
Bitcoin is currently undervalued?
It’s hard to say when to buy Bitcoin. It depends on the strategy of each and risk that we wish to take on the financial markets. On the other hand, one can estimate that an asset is undervalued based on indicators. Let’s not forget that an asset can remain undervalued for a long time, this must be taken into account when buying an asset over the long term..
Bitcoin is touching the 200-period moving average on a weekly basis
A moving average is a mean prices over a given period. Since 2013, the weekly 200-period moving average has served as the support during bear markets:
This moving average is around $22,400, the Bitcoin price is currently below it. There are less than 48 hours to Bitcoin to close above or near this moving average. It is an indicator that is widely used in traditional markets and it works very well on Bitcoin until today. Bitcoin is considered undervalued when the price reaches this moving average.
Bitcoin vs Cost of Production
Like a raw material, Bitcoin has a production cost. It depends on the cost of theelectricity to secure the network and to mine Bitcoin. Bitcoin miners are the basis of the productionthey can drive the sale of bitcoin based on price. Here is the graph of the cost of production according to an indicator available on Tradingview:
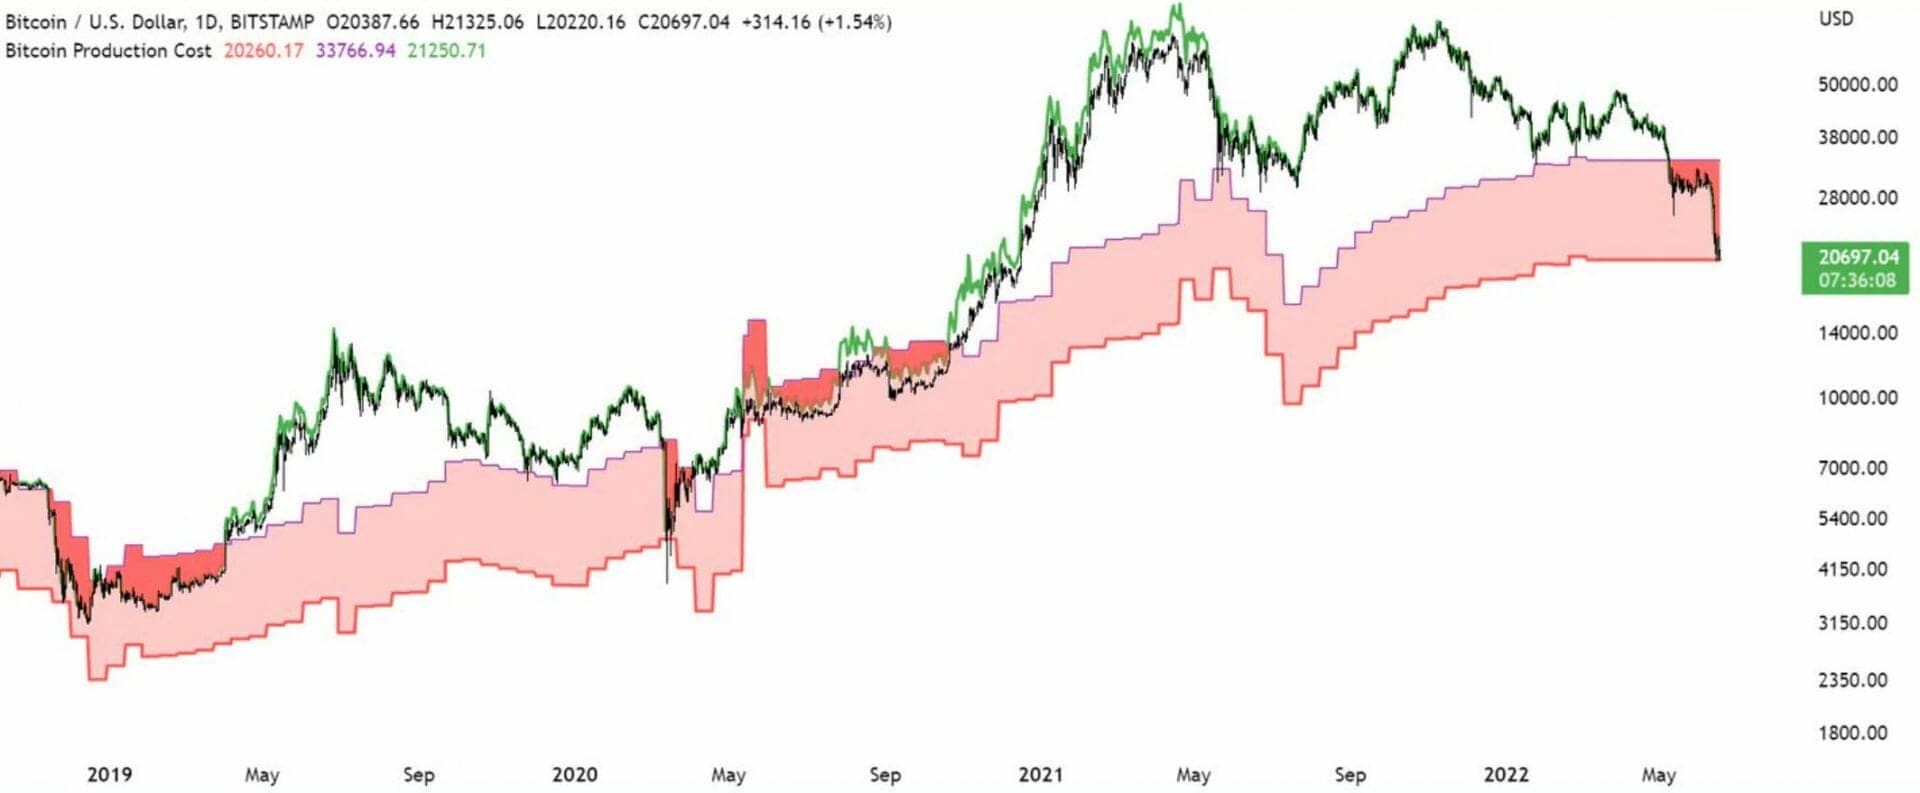
Bitcoin is currently at its cost of production. This metric shows that miners have no interest in selling at these prices since they would not make a profit. There is therefore theoretically less sale in the market.
You have to be careful with this data. This is an average of theoretical output, not all the players agree on defining the cost of production in this way. This metric nevertheless allows us to give an idea of the market situation.
The realized price of Bitcoin
It’s a metric on chain very interesting. Indeed, the indicator is the result of the ratio of realized capitalization to outstanding supply. A filtered is enforced to only consider network tokens that are assets (excluding dormant or non-liquid tokens). The indicator grows in a bull marketin which tokens are sold for profit:
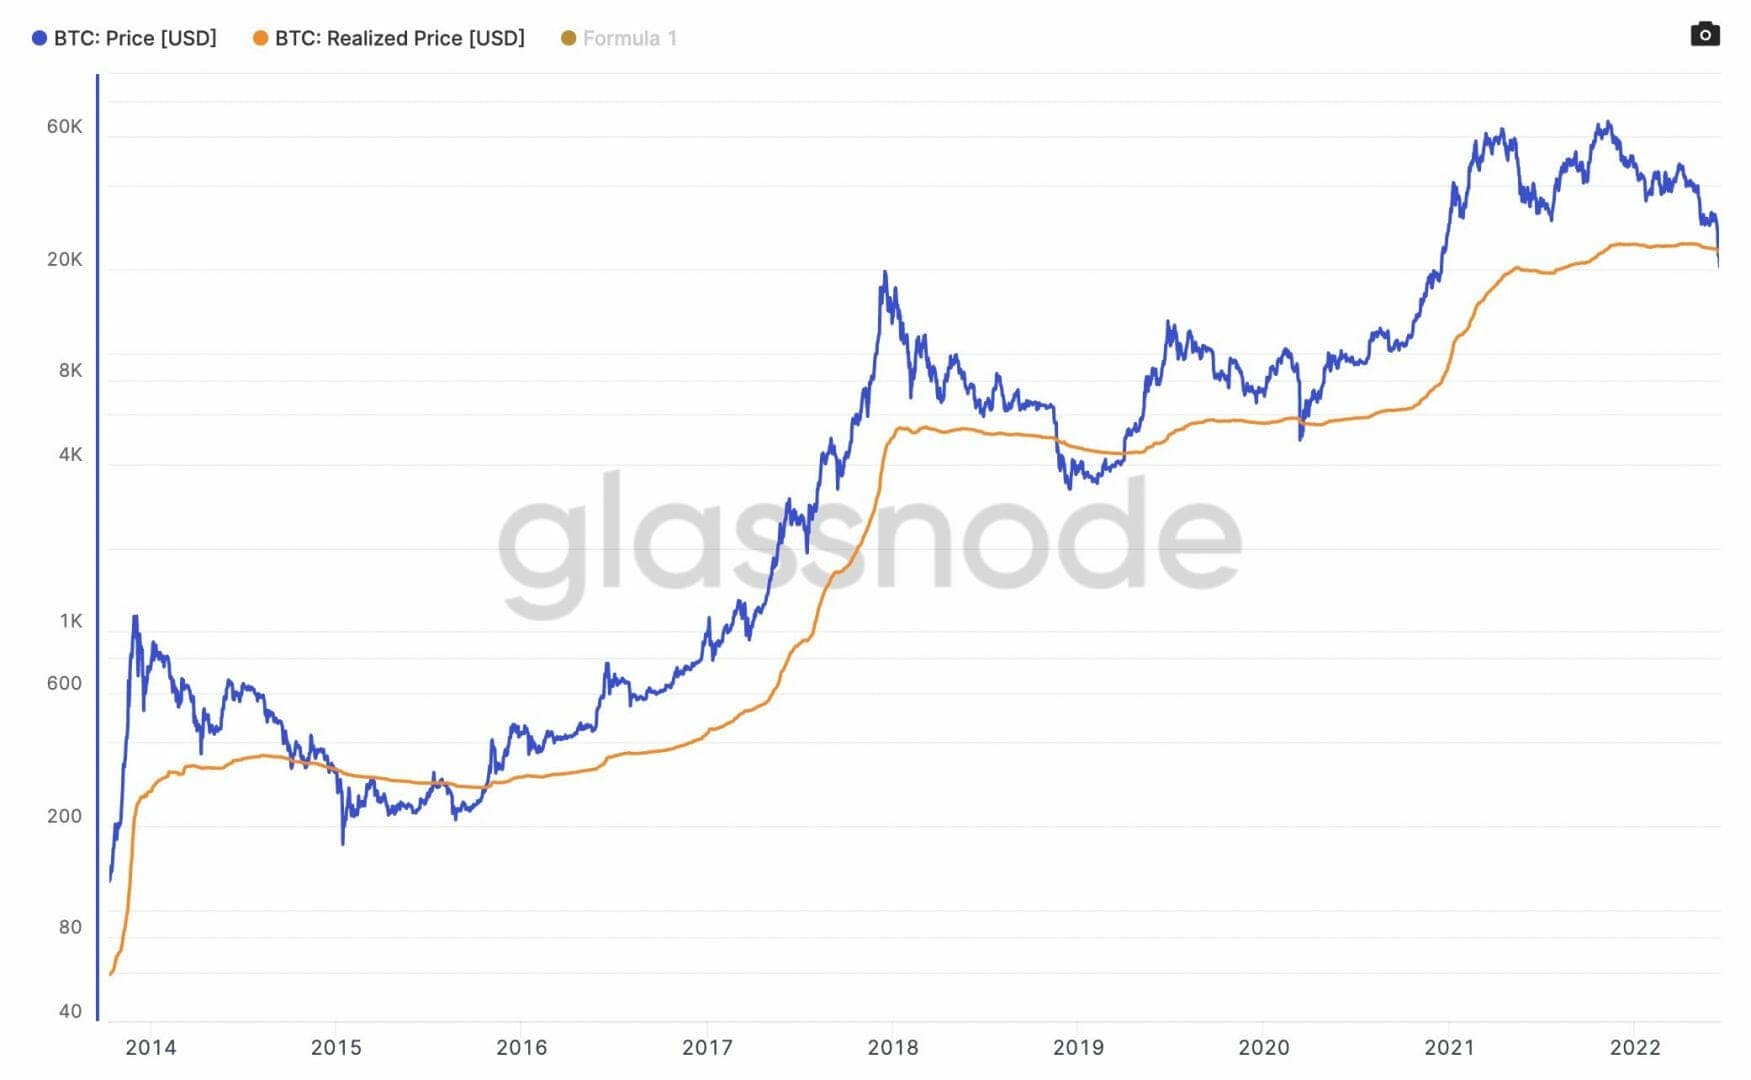
As we can see, when the price goes below the indicator curve, Bitcoin is very undervalued. Until today it wasexcellent long-term buying areas. Is this time different?
The MVRV Z-score of Bitcoin
This date on chain lets you know if Bitcoin is undervalued or overrated :
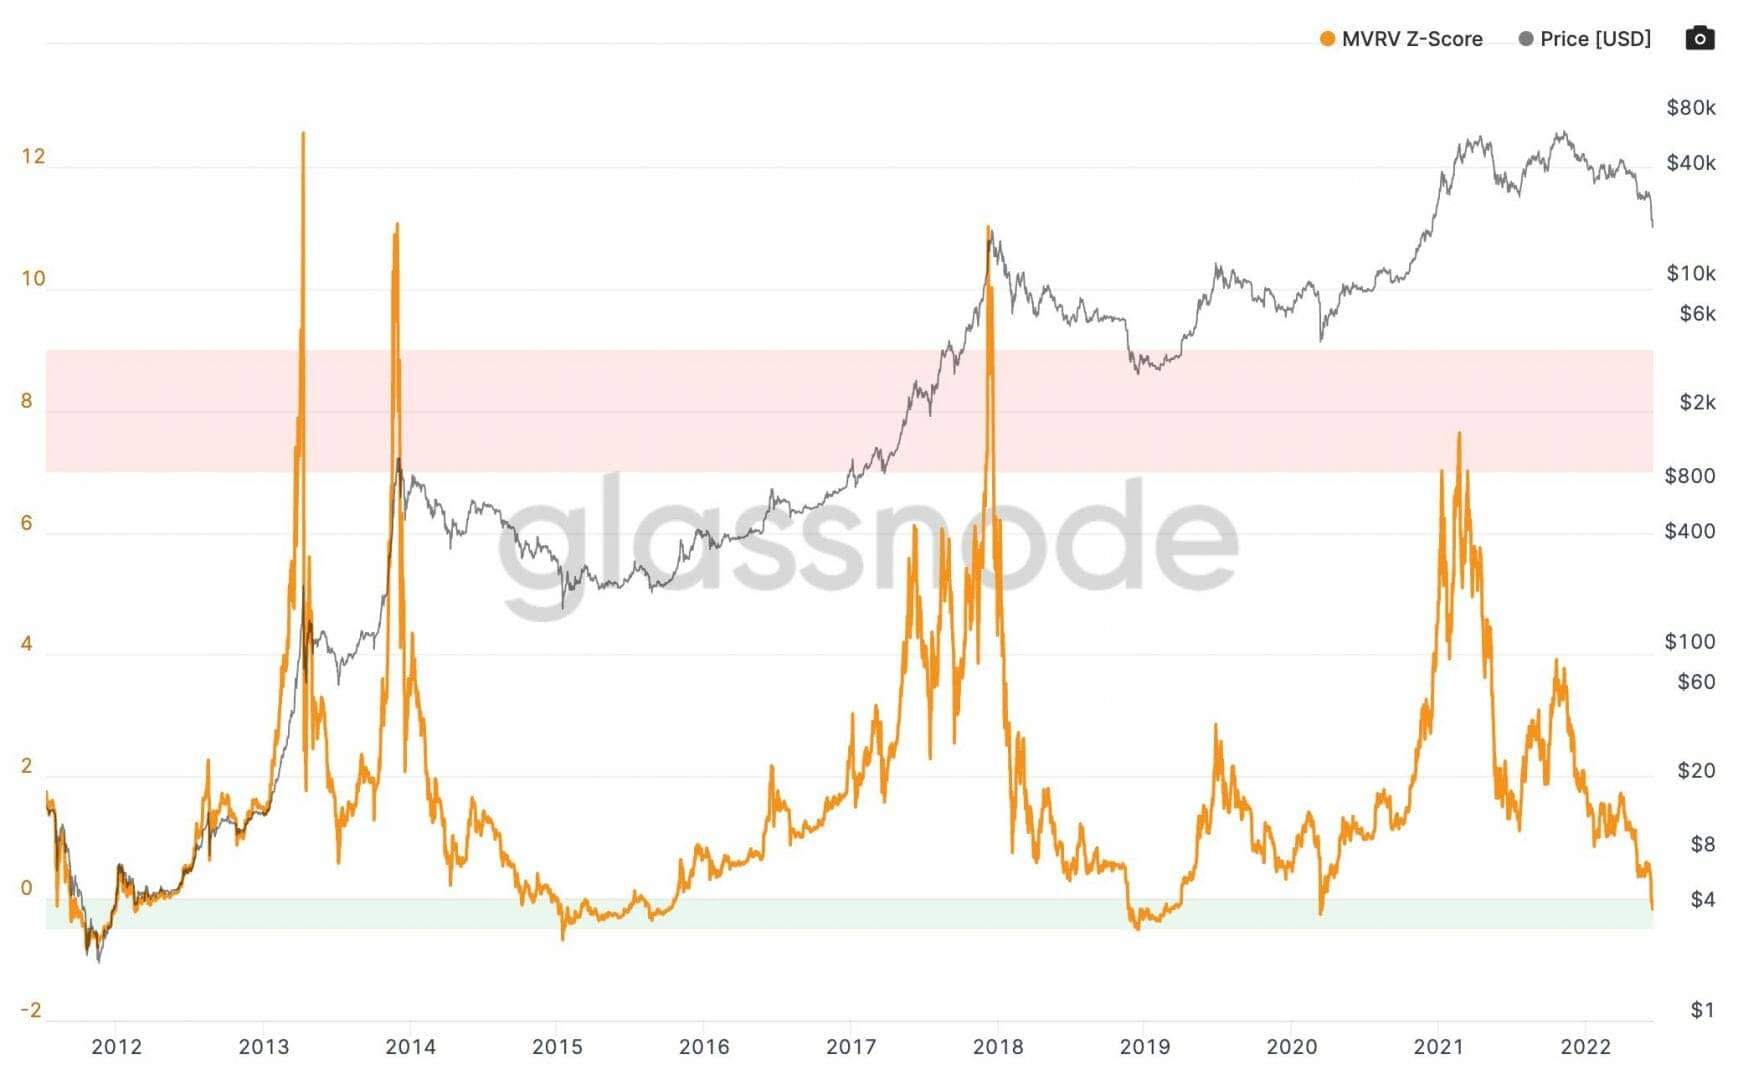
When the indicator is redthis means that Bitcoin is in overheated. On the other hand, when it is greenthis indicates that Bitcoin is interesting for the long term. Whenever the indicator has been in this zone, Bitcoin has found a market low.
All the data presented here shows that Bitcoin is considered, currently, as undervalued. An asset can remain in this state for a long time, which is why it is interesting to see if the actors have capitulatedor if there is still somehope.
Investors Sell Bitcoin at a Loss
To know if the actors are in the process of capitulateit is necessary to know if the actors have a behavior of Hodl or if they get rid of Bitcoin at a loss to buy it lower:

When we look at the recorded losses on the network since January 2018, it’s final. The losses recorded are records. Players who bought the bull cycle of previous years are now sell at Lost. The peak is higher than that known last May. We can legitimately speak of capitulation here.
You can also watch the latent lossesthey can give additional information on the behavior of the actors:
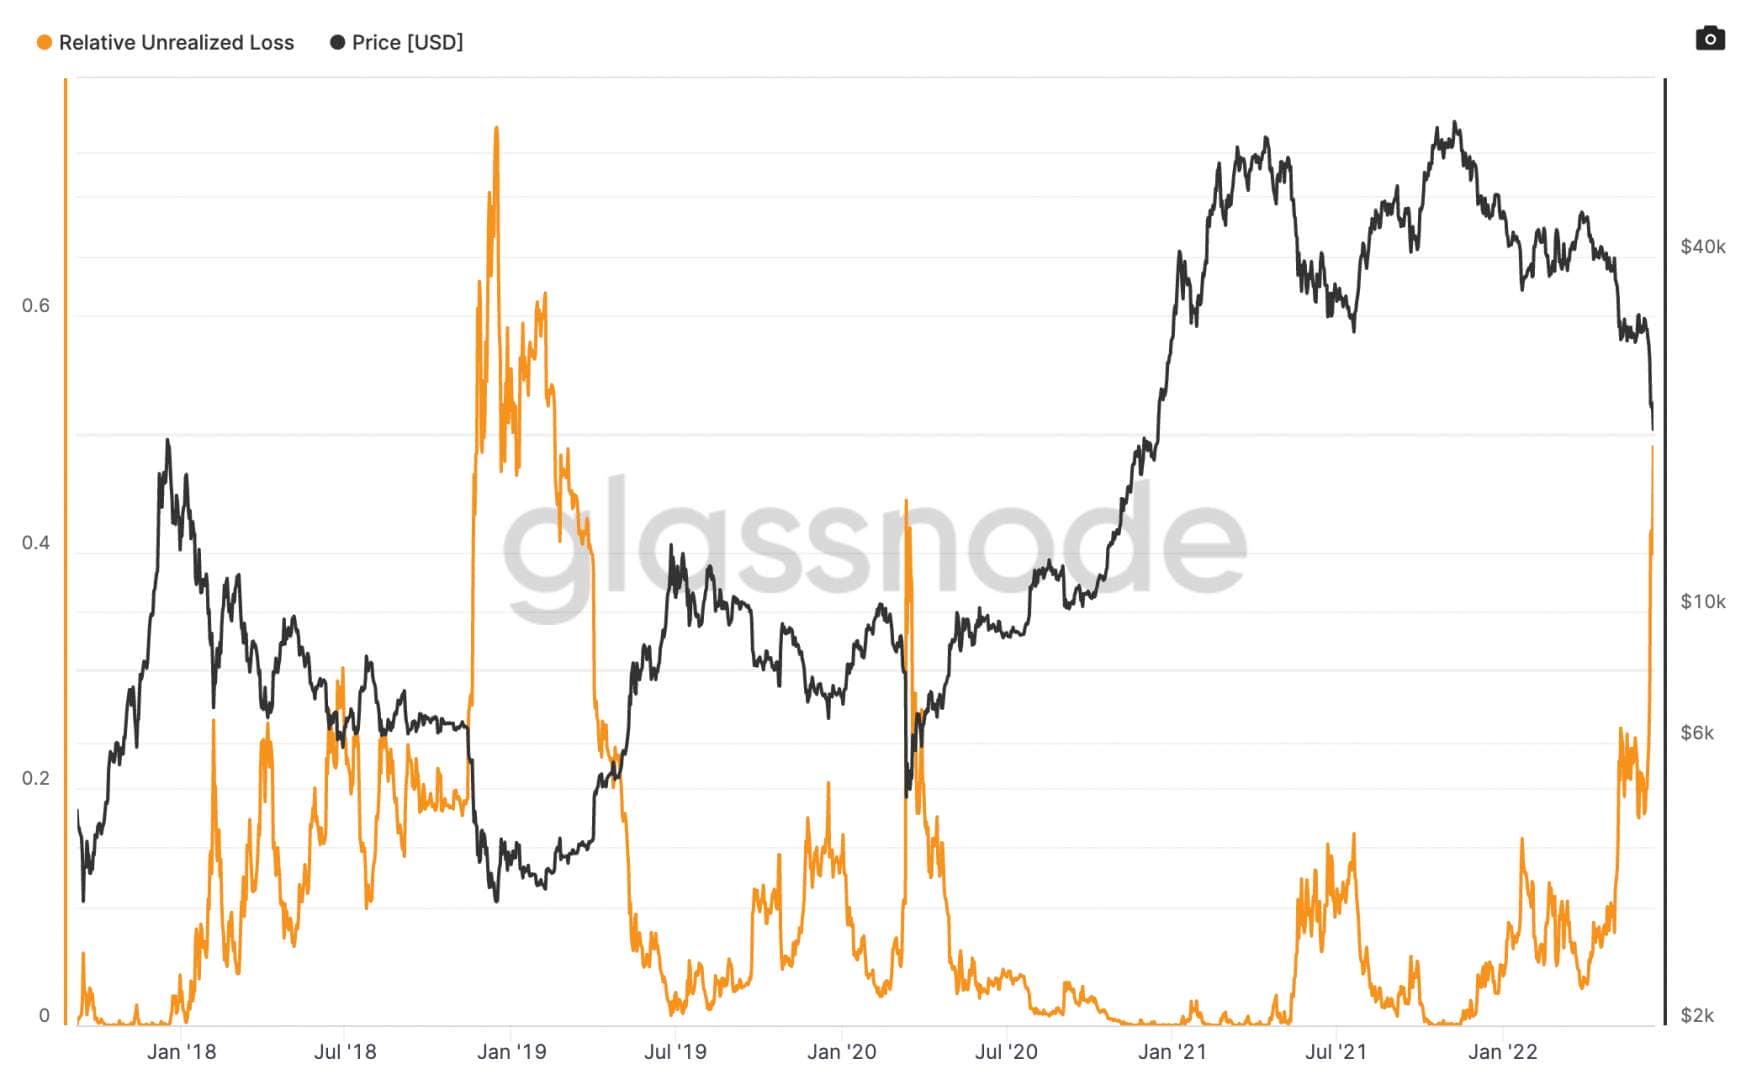
When surrender phase, latent losses increase sharply, because the price of Bitcoin is below the players’ buy price. Once the movement is over, the peak fades, leaving room for latent losses that are almost non-existent. The capitulation phase took place and the actors sold at a loss.
According to Glassnode and according to this indicator, we could be in the first phase of surrender. Indeed, if the actors have not capitulated, the peak could continue to climb with a price that continues to fall. This indicator makes it possible to know, after the fact, that the capitulation has taken place. This was the case in March 2020 and early 2019.
Has the recent sharp fall made it possible to make the players capitulate or is it still not enough? We can’t tell with this data.
Speculation is at a standstill
The last few months have been marked by strong speculation. The actors used the derivative products to use theleverage. Thus, the platforms lend money, and the actors think they can earn money easily and quickly. The reality, however, is quite different.

The number of open positions has dropped drastically in recent months. This metric is at a level corresponding to the beginning of 2021. It seems that players no longer believe in easy money and that is a good sign. The actors may be capitulate in derivatives markets.
Is market sentiment showing capitulation?
Markets mark highs when players are euphoric and the money seems easy. The market lows are marked by the despair and the fear. Market sentiment is widely used in traditional markets, it is interesting to study it in the cryptocurrency market.
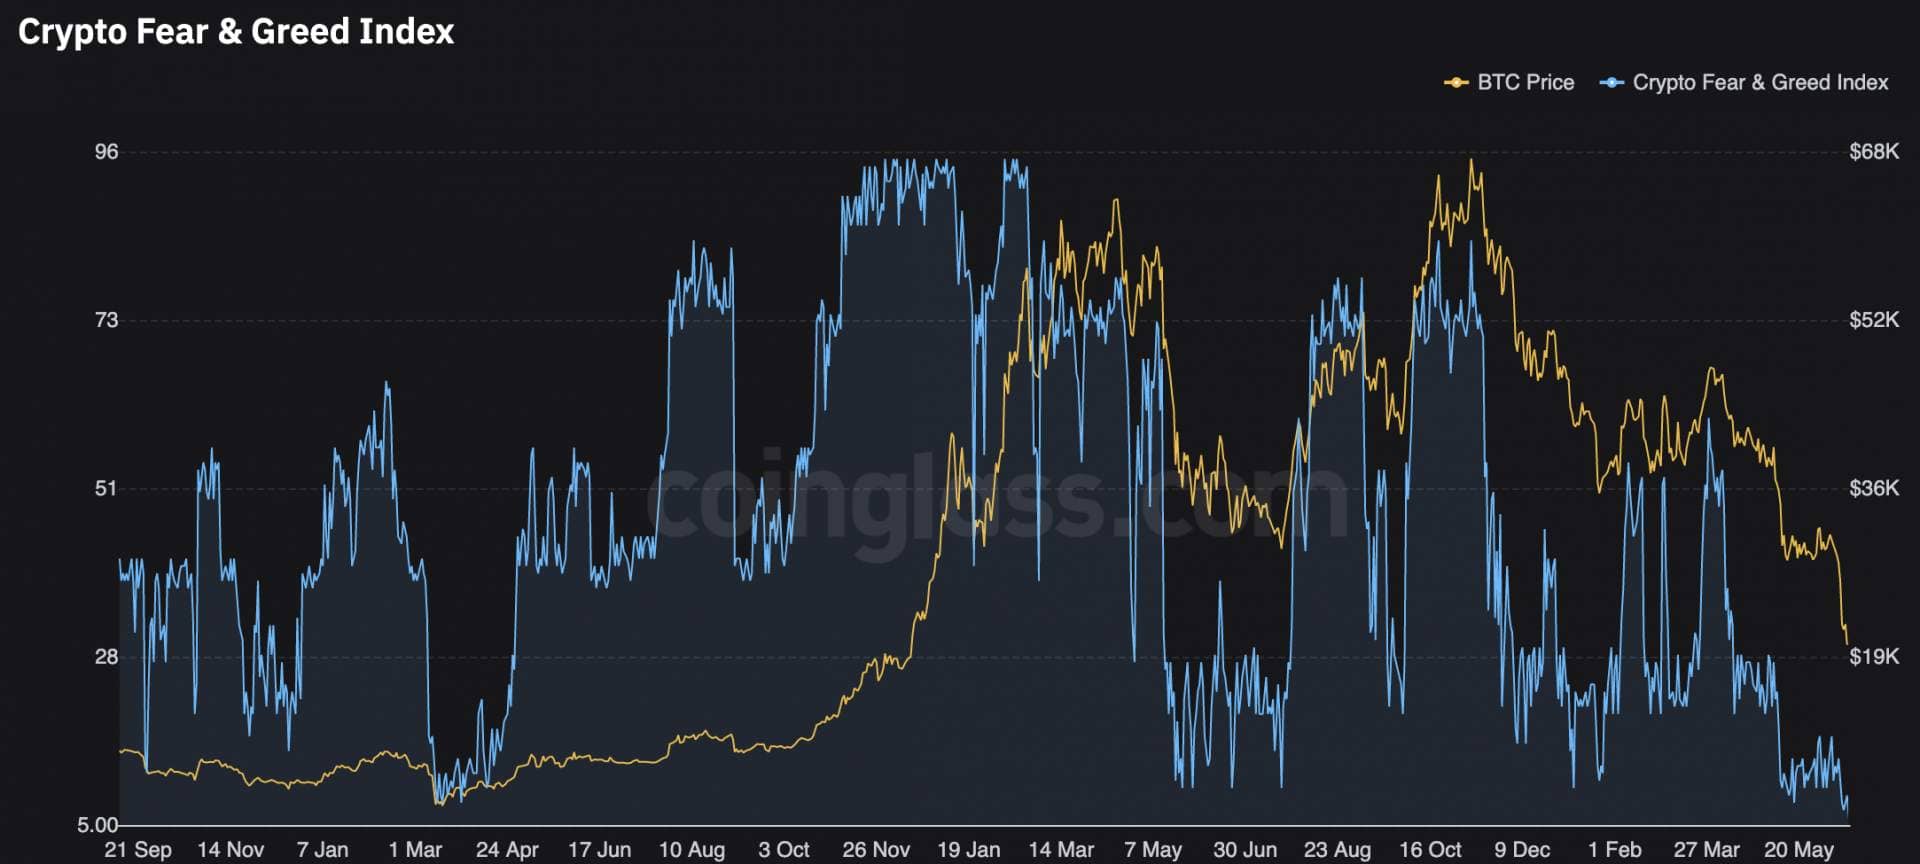
The Crypto Fear and Greed is an indicator of market sentiment. He has not never been so low since the Covid crash in March 2020. It is difficult to compare, because the macroeconomic situation is different compared to the Covid crash, but it makes it possible to realize in which extreme we are.

the weighted feeling brings together social media data to make it an indicator. According to this indicator, which has a different calculation from the Crypto Fear and Greed, the situation is not not as chaotic as during the Covid crash. Actors don’t seem to be in a situation of extreme fear like early 2020. It doesn’t have to have a spike similar to the Covid crash, but we cannot conclude that we are witnessing a capitulation on this metric.
In the end, Bitcoin is undervalued. As we have seen, the price is below the 200-period moving average on a weekly basis and at the level of the production price. Many indicators show that Bitcoin is in a very interesting long-term buy zone if we believe in what Bitcoin can bring. Players are currently selling at a loss at record highs and speculation has plummeted in recent months. On the other hand, the market sentiment is low, but the situation is not comparable to that known in March 2020. At the time the price had fallen by more than 40% in a single day, and this had made it possible to find the investors’ breaking point. Right now, bitcoin fallsbut it is not certain that the breaking point has been found, especially since the macroeconomics is still just as uncertain.
Is it possible to be gwinner every time? Whether the Bitcoin price is in great shape, or going through turbulence, Coin Trading offers you to increase your chances of success. Indeed, Coin Trading allows individuals to access a trading tool algorithmic and 100% automated. A real trend mechanism, this tool has been designed to adapt to market reversals and position itself on the most dynamic crypto assets of the moment.
