While the crypto reserve currency Bitcoin (BTC) cannot initiate a sustainable upward trend this week either, some of the top 100 altcoins are showing their bullish side. The next trading week will show whether this development is sustainable.
Sideways phases often last longer than many investors would like. The directionlessness of the crypto reserve currency Bitcoin (BTC) prevents a more sustainable recovery in the overall market this week as well. However, some brave investors are increasingly investing in altcoins again. The recently clearly shaken DeFi sector can pick up some momentum after a months of drought. Compound (COMP) in particular is currently bullish and is increasing in value by more than 60 percent. However, as long as Bitcoin cannot generate a sustainable upward trend, investors should also realize short-term gains and not rely on an imminent rise back towards all-time highs.
Best price development among the top 10 altcoins:
Uniswap (UNI)
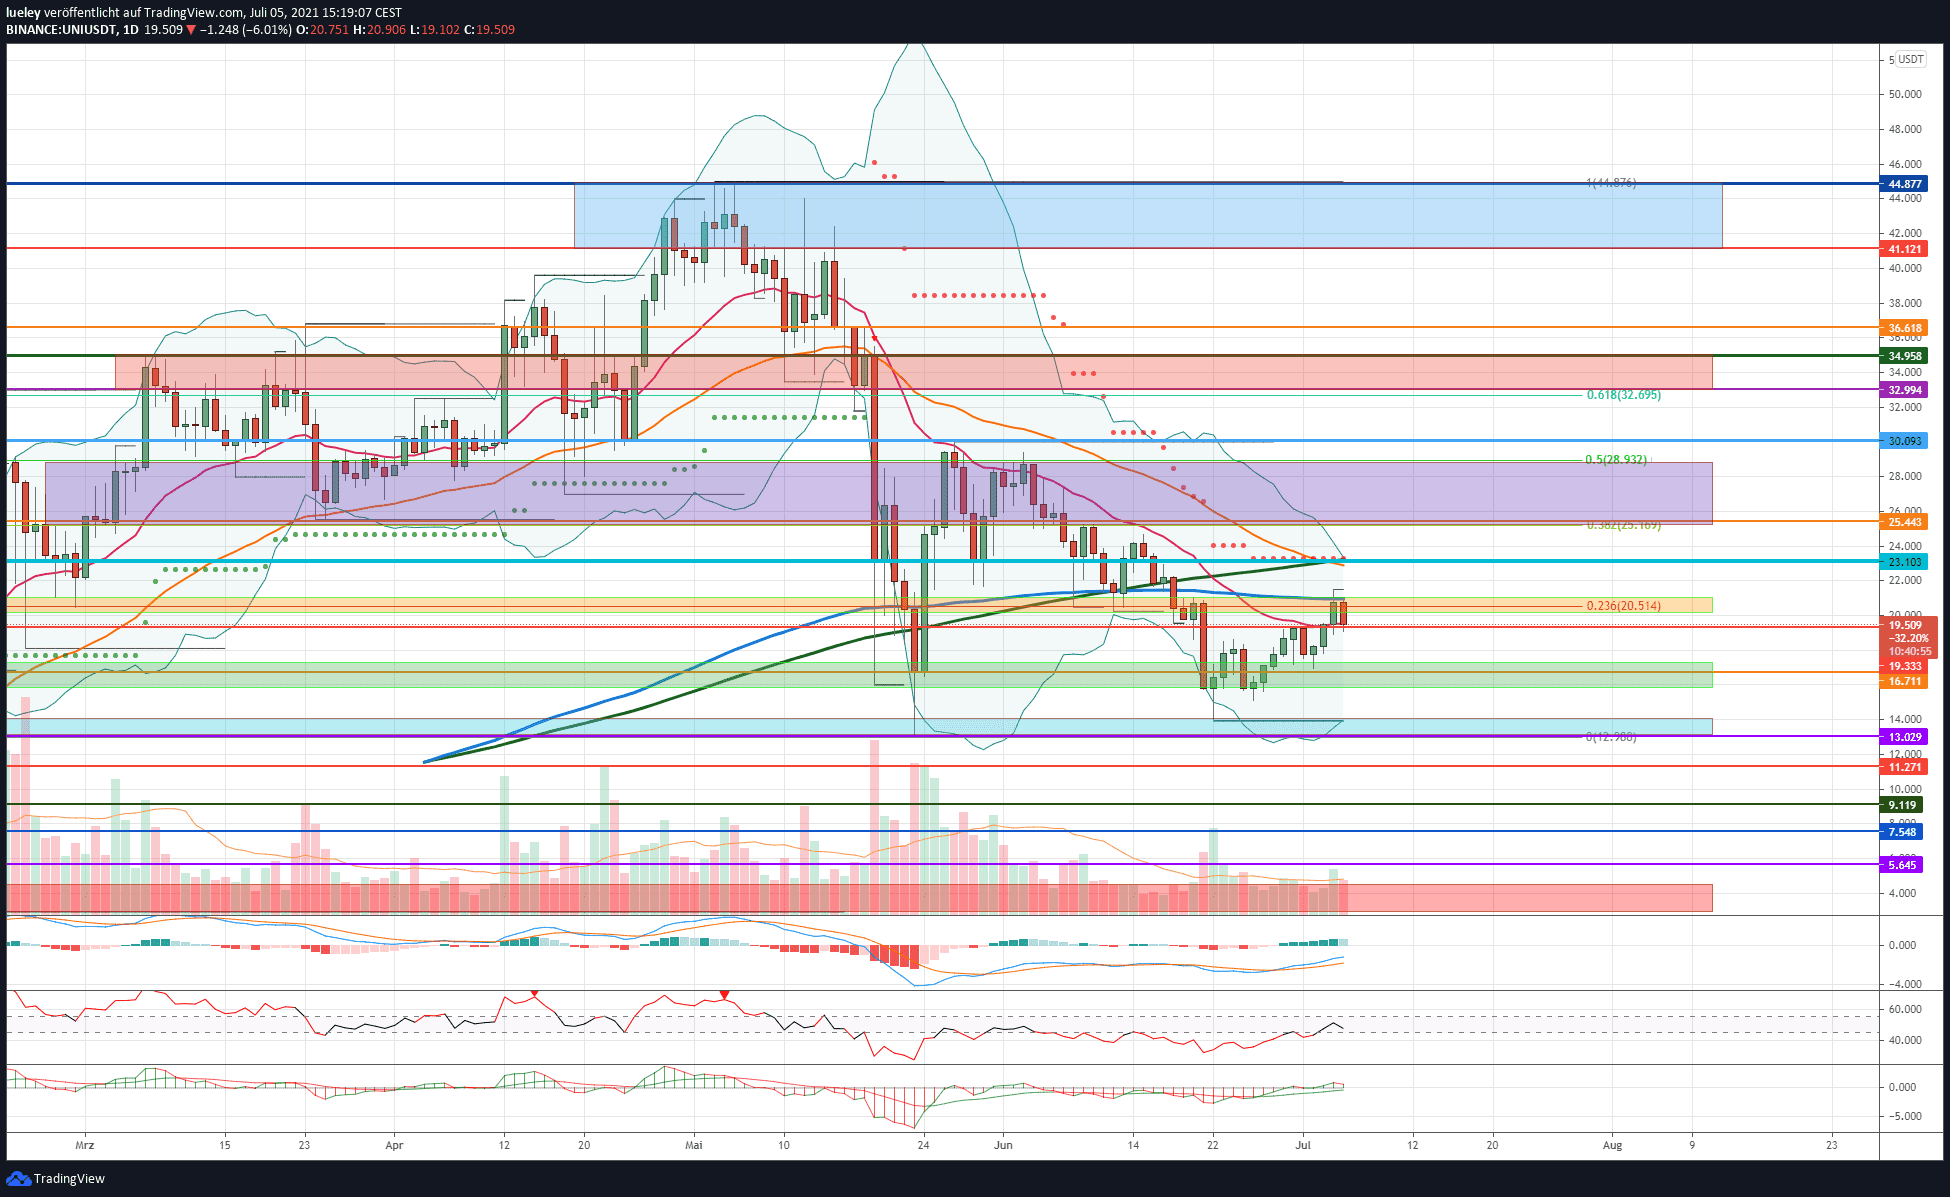
The price of the DeFi protocol Uniswap has risen significantly northwards in the last few days of trading and closes the week on a ten-day high at USD 20.73. The UNI rate rises back above the EMA20 (red) at 19.33 USD and only bounced slightly downwards at the moving resistance line EMA200 (blue). A daily closing price above USD 21.06 should give a further boost towards USD 23.10.
Bullish variant (uniswap)
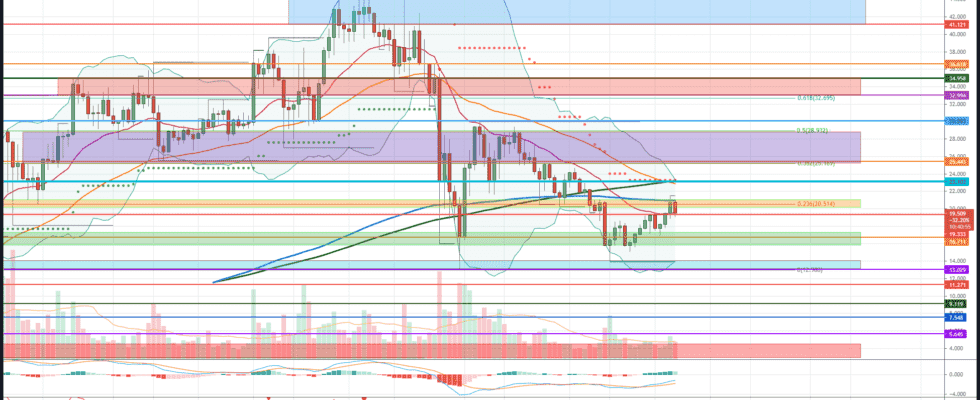
After a recent clearly bearish price development, Uniswap can gain ground on the weekend and end the week with a price increase of almost 20 percentage points. The bulls managed to recapture the cross resistance from EMA20 (red) and the horizontal resistance line for the time being and to penetrate as far as the EMA200. The task now is to sustainably overcome the range between USD 20.51 and USD 21 in order to unleash further price potential. If the UNI rate overcomes this resistance area, the next resistance at USD 23.10 comes into focus. The MA200 (green), Supertrend, EMA50 (orange) and the upper Bollinger band run here and represent a strong hurdle for the bull camp. Only when Uniswap can sustainably overcome this strong resist will the next target price be activated at USD 25.18. The 38th Fibonacci retracement of the current price movement runs here. If this resistance cluster is successfully broken through, a march through to the top of the purple resist area at USD 28.94 should be planned. Here the 50s Fibonacci retracement of the complete downward movement as well as the course highs from the beginning of June 2021 is running.
If the bull camp can also dynamically overcome this price level, an increase of up to USD 30.09 is conceivable. In addition to the blue horizontal resistance line, the intermediate high of May 27, 2021 can also be found here. If this resistance level is also broken sustainably, price targets in the area of the red resistance zone will be activated. For one, the 61 Fibonacci retracement is at USD 32.70. There is also strong horizontal resistance at USD 34.95 from March 2021. The bulls must therefore try to stabilize the UNI rate above USD 35.00 in order to target the next target at USD 36.61. If this resistance is also regained by the end of the day, the chance of a subsequent rise increases into the blue resistance zone. In the coming months, the UNI exchange rate could initially approach USD 41.12 and then attack the all-time high of USD 44.87. However, as long as Uniswap cannot establish itself sustainably above USD 23.10, the downside risks will continue to prevail.
Bearish variant (uniswap)
If, on the other hand, Uniswap falls back below the EMA20 (red), the green support zone between USD 17.34 and USD 15.88 comes into focus again. If there is no clear resistance on the part of the buyer and the daily closing price falls below the green support area, a relapse towards the previous week’s low of USD 14.00 is likely. If this support level is also dynamically undershot, the correction should initially extend to around USD 13.02. This is where the low of May 23, 2021 can be found. If the bears manage to soften this support too, a price slide to USD 11.27 or even USD 9.11 should be planned as a result. If the overall market is also trending further south in the coming period, Uniswap could correct again more significantly and target the horizontal support at USD 7.54. However, as long as the crypto reserve currency Bitcoin does not fall sustainably below USD 30,000, a correction below the key support at USD 13.02 is not to be expected.
Indicators (Uniswap)
The MACD indicator was able to generate a fresh buy signal in the last few days of trading. The RSI also made it back into the neutral zone between 45 and 55 and can therefore be rated as neutral. Only when the RSI can break out dynamically above 55 is a further increase in the UNI rate to be expected.
Worst price development among the top 10 altcoins:
Dogecoin (DOGE)
Dogecoin once again trended weakly in the past trading week and threatens to fall again towards the EMA200 (blue) on Monday, July 5th. The DOGE price missed the chance to break back above the EMA20 (red) several times in the last 2 weeks of trading. Dogecoin is currently trading at the top of the blue support zone again at USD 0.22. If this bearish bias continues, a retest of the lower edge at USD 0.21 is likely. As long as the DOGE price cannot dynamically overcome the purple resistance area, the risks of a renewed price correction to the multiple support from MA200 (green), trend low on June 22nd and lower Bollinger band at USD 0.17 outweigh the risks.
Bullish variant (Dogecoin)
The course of Dogecoin is still not moving sustainably. So far, investors have not been able to overcome the EMA20 (red) at the daily closing price. In the last hours of trading, the DOGE price slipped back below the horizontal resistance at USD 0.25. However, in order to generate fresh upside potential, Dogecoin has to rise sustainably back above USD 0.26. Only when the bulls manage to move the DOGE rate over the EMA20 into the purple resistance zone will it be decided whether Dogecoin can build on its strength from spring this year in the medium term. If the DOGE price breaks out of the multiple resistance area from EMA50 (orange), 23 Fibonacci retracement and supertrend between USD 0.30 and USD 0.31, the chart will brighten noticeably. If the breakout succeeds, a surge into the orange resistance area between USD 0.34 and USD 0.38 is likely. If Dogecoin can subsequently leave the orange resistance area and thus the 38 Fibonacci retracement behind, the 50 Fibonacci retracement at USD 0.45 will move into the focus of investors. The monthly high from June 2021 can also be found here.
If the DOGE price breaks through this resistance cluster dynamically, a subsequent increase up to the red resistance area between USD 0.52 and USD 0.57 must be planned. In particular, the USD 0.52 represents an important hurdle on the way towards USD 0.60. This is where the 61 Fibonacci retracement runs, which often represents the maximum retacement target, a downward movement. If the bulls manage to overcome this resistance at the daily closing price, the area around USD 0.57 comes into focus. If a dynamic rise above the red resistance area succeeds, a march through to the 78 Fibonacci retracement at USD 0.62 is conceivable. Only when the overall market returns to its old strength, Dogecoin could also generate new upward momentum up to the red horizontal resistance line at USD 0.70. Then the all-time high of USD 0.74 will move into the perspective of investors again. From the current perspective, more upside potential is unlikely for the time being.
Bearish variant (Dogecoin)
If the DOGE price falls below the blue support zone in the coming trading days and the EMA200 (blue) at USD 0.20 does not stop there, the bears will try to approach the weekly low at USD 0.16. In addition to the lower Bollinger band, the MA200 (green) can also be found in this area. Therefore, increased resistance from the bull camp can be expected again. If, on the other hand, the bears manage to push Dogecoin below this support cluster at the daily closing price, the next bearish price target in the area of 0.12 USD will be activated. A persistent weakness in the overall market could even allow Dogecoin to correct in the medium term until the next important support at USD 0.086.
The old all-time high from February 2021 runs at this support level. If Dogecoin does not stabilize here either and continues to trend weakly, the downward momentum could initiate a relapse to USD 0.05. If Bitcoin falls back towards USD 20,000 in the coming months, a price drop to the maximum bearish price target of USD 0.022 cannot be ruled out. As long as Dogecoin does not give up the strong support at USD 0.16, such a price slump is initially unlikely.
Indicators (Dogecoin):
The RSI has slipped below 45 again in the last few days of trading, triggering a sell signal again. Although the MACD indicator currently shows a slight buy signal, a sustained price weakness could quickly turn this snapshot into a sell signal.
Top 10 stability
Bitcoin is trading relatively weakly in the USD 33,500 area at the start of the week. The top 10 altcoins, on the other hand, appear a bit more bullish. With the exception of Dogecoin (DOGE) with a discount of six percent, all cryptocurrencies among the top 10 show a price increase. Uniswap (UNI) shows itself to be the strongest with a price increase of around 20 percent, followed by Ethereum (ETH) with a price increase of 17 percent. Bitcoin Cash (BCH) can also increase in value in double digits with a weekly plus of 10 percentage points. In the rankings, the battle for the lower places continues. Uniswap can regain its eighth place and push Bitcoin Cash to ninth place and Litecoin (LTC) to 10th place.
Winner and Loser of the Week
The overall market can turn the tables this week after three weeks of weak trading and initiate a cautious recovery rally. Many Altcoins are performing better this week than Bitcoin itself. The long list of weekly winners is led by XDC Network (XDC) with a 70 percentage point premium, followed by Compound (COMP) with 68 percent and ECOMI (OMI) with 56 percent. A look through the list of outperformers among the top 100 altcoins shows that the DeFi sector in particular is experiencing increased investor interest again after a long dry spell.
However, some coins also have to cope with setbacks. Theta Fuel (TFUEL) with 13 percent in the red, Theta Network (THETA) with a price decline of 10 percentage points as well as Dogecoin (DOGE) and Amp (AMP) with six percent price discount each form the top of the few underperformers of the past week. This means that the majority of the top 100 altcoins will rise faster than the crypto key currency Bitcoin this trading week. The next trading week will show whether this is just a flash in the pan or whether a sustainable reversal is developing in the overall market.
Disclaimer: The price estimates presented on this page do not constitute buy or sell recommendations. They are only an assessment of the analyst.
The chart images were created using TradingView created.
USD / EUR exchange rate at the time of going to press: 0.84 euros.