The vast majority of the crypto market tended south in the past trading week. Bitcoins (BTC) significant relapse back to 42,923 USD did not leave many Altcoins unaffected.
Once again, investors in the crypto market cannot agree on a clear direction. Although some top 100 altcoins jumped to a new all-time high in the meantime, at the beginning of the week many cryptocurrencies are tending further south. Overall, however, the current market situation can be assessed as bullish. In particular, the price strength of many blockchain ecosystems such as Solana (SOL), Terra (LUNA) and Avalanche (AVAX) give hope for a bullish final quarter this year.
Best price development among the top 10 altcoins:
Solana (SOL):
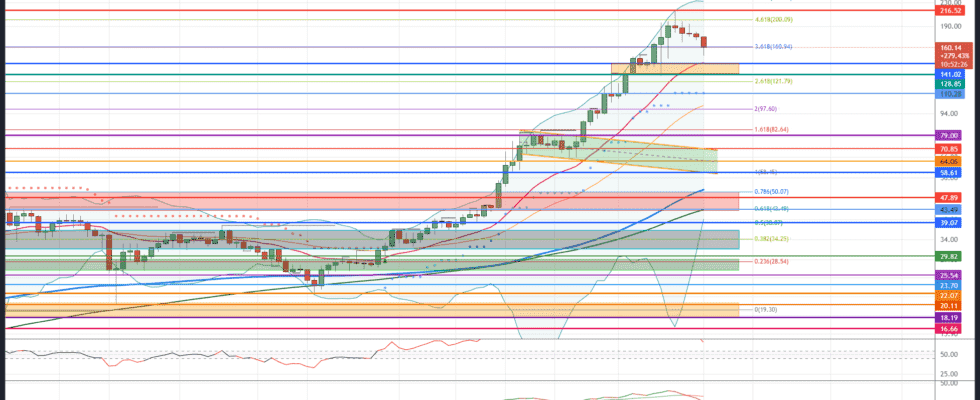
Despite profit-taking in the last few trading days, Solana recorded a price plus in a weekly comparison. However, after rising more than 400 percentage points since breaking above the old all-time high, this consolidation is not surprising. As long as Solana remains above an EMA20 (red) at USD 141.02, this development is completely unproblematic from a bull’s point of view, as already stated in the analysis of September 10th.
Bullish variant (Solana)
The current price weakness on the overall market in the last few days of trading also allows Solana to consolidate for the time being. If the bulls manage to stabilize the price above USD 141.02, further price increases should be planned in the future. Even a correction of up to USD 110.28 shouldn’t worry investors, because of course, sharp price increases are often followed by larger price corrections. If the SOL price maintains itself above the supertrend at USD 110.28 and conquers the area around the 361 Fibonacci extension, the view is again directed towards the 461 Fibonacci extension at 200.09 USD.
Only when Solana stabilizes above this price mark at the closing price of the day will the all-time high of USD 216.52 come into focus again. If the buyer store can then develop enough momentum and crack the all-time high, the next price target will be activated at USD 239.24. The next target price can be found here in the form of the 561 Fibonacci extension. If the overall market continues to develop positively in the future, a march through to the maximum price target of USD 278.38 that can be derived is also conceivable in the medium term. The 661 Fibonacci extension is to be assessed as the maximum bullish projection target for the time being.
Bearish variant (Solana)
If, however, the SOL rate continues to correct and gives up the 138 Fibonacci extension at USD 160.94 per day’s close, the EMA20 (red) at USD 141.02 comes into focus. A relapse below that suggests a retest from the previous week’s low of $ 128.85. A quick retest of the 261 Fibonacci extension at USD 121.79 should also be considered. A first directional decision is made at 110.28 USD at the latest. The bulls have to prove themselves at this cross-support between the supertrend and the horizontal support level. A sustainable abandonment of this price mark brings the area around USD 97.60 back into focus. Here you can find the 200 Fibonacci extension and the EMA50 (orange). If the bears manage to dynamically undercut this support, price targets between USD 82.64 and USD 79.00 will be activated. The 161 Fibonacci extension and in particular the breakout level before the price rally act as a possible stepping stone to the north.
The way back to the start
A ricochet to the north is therefore likely in the first attempt. If the overall market comes under further pressure in the coming weeks and Solana falls back below USD 79.00, a correction widening to USD 70.85 should be planned. This is where the top of the bull flag is paired with a relevant horizontal level of support. Should the SOL rate not stabilize here either, a fallback to USD 64.06 cannot be ruled out. In the future, Solana could also hit the maximum bearish price target in the form of the old all-time high at USD 58.61. At this price level, the old all-time high of May 19, the bulls will want to initiate a counterstrike. If, contrary to expectations, this central support is given up on a sustained basis, a retest of the EMA200 (blue) at USD 51.10 cannot be ruled out. For the time being, however, a relapse into this chart region is to be viewed as very unlikely. This snapshot will only change if Bitcoin breaks down well below USD 38,000.
Indicators (Solana):
The situation with the RSI and the MACD indicator is currently becoming increasingly cloudier. The RSI is clearly trending south and threatens to return to the neutral zone between 45 and 55 if the price weakens. The MACD indicator also threatens to generate a sell signal in the near future, which could put the SOL price under further pressure.
Worst price development among the top 10 altcoins:
Dogecoin (DOGE)
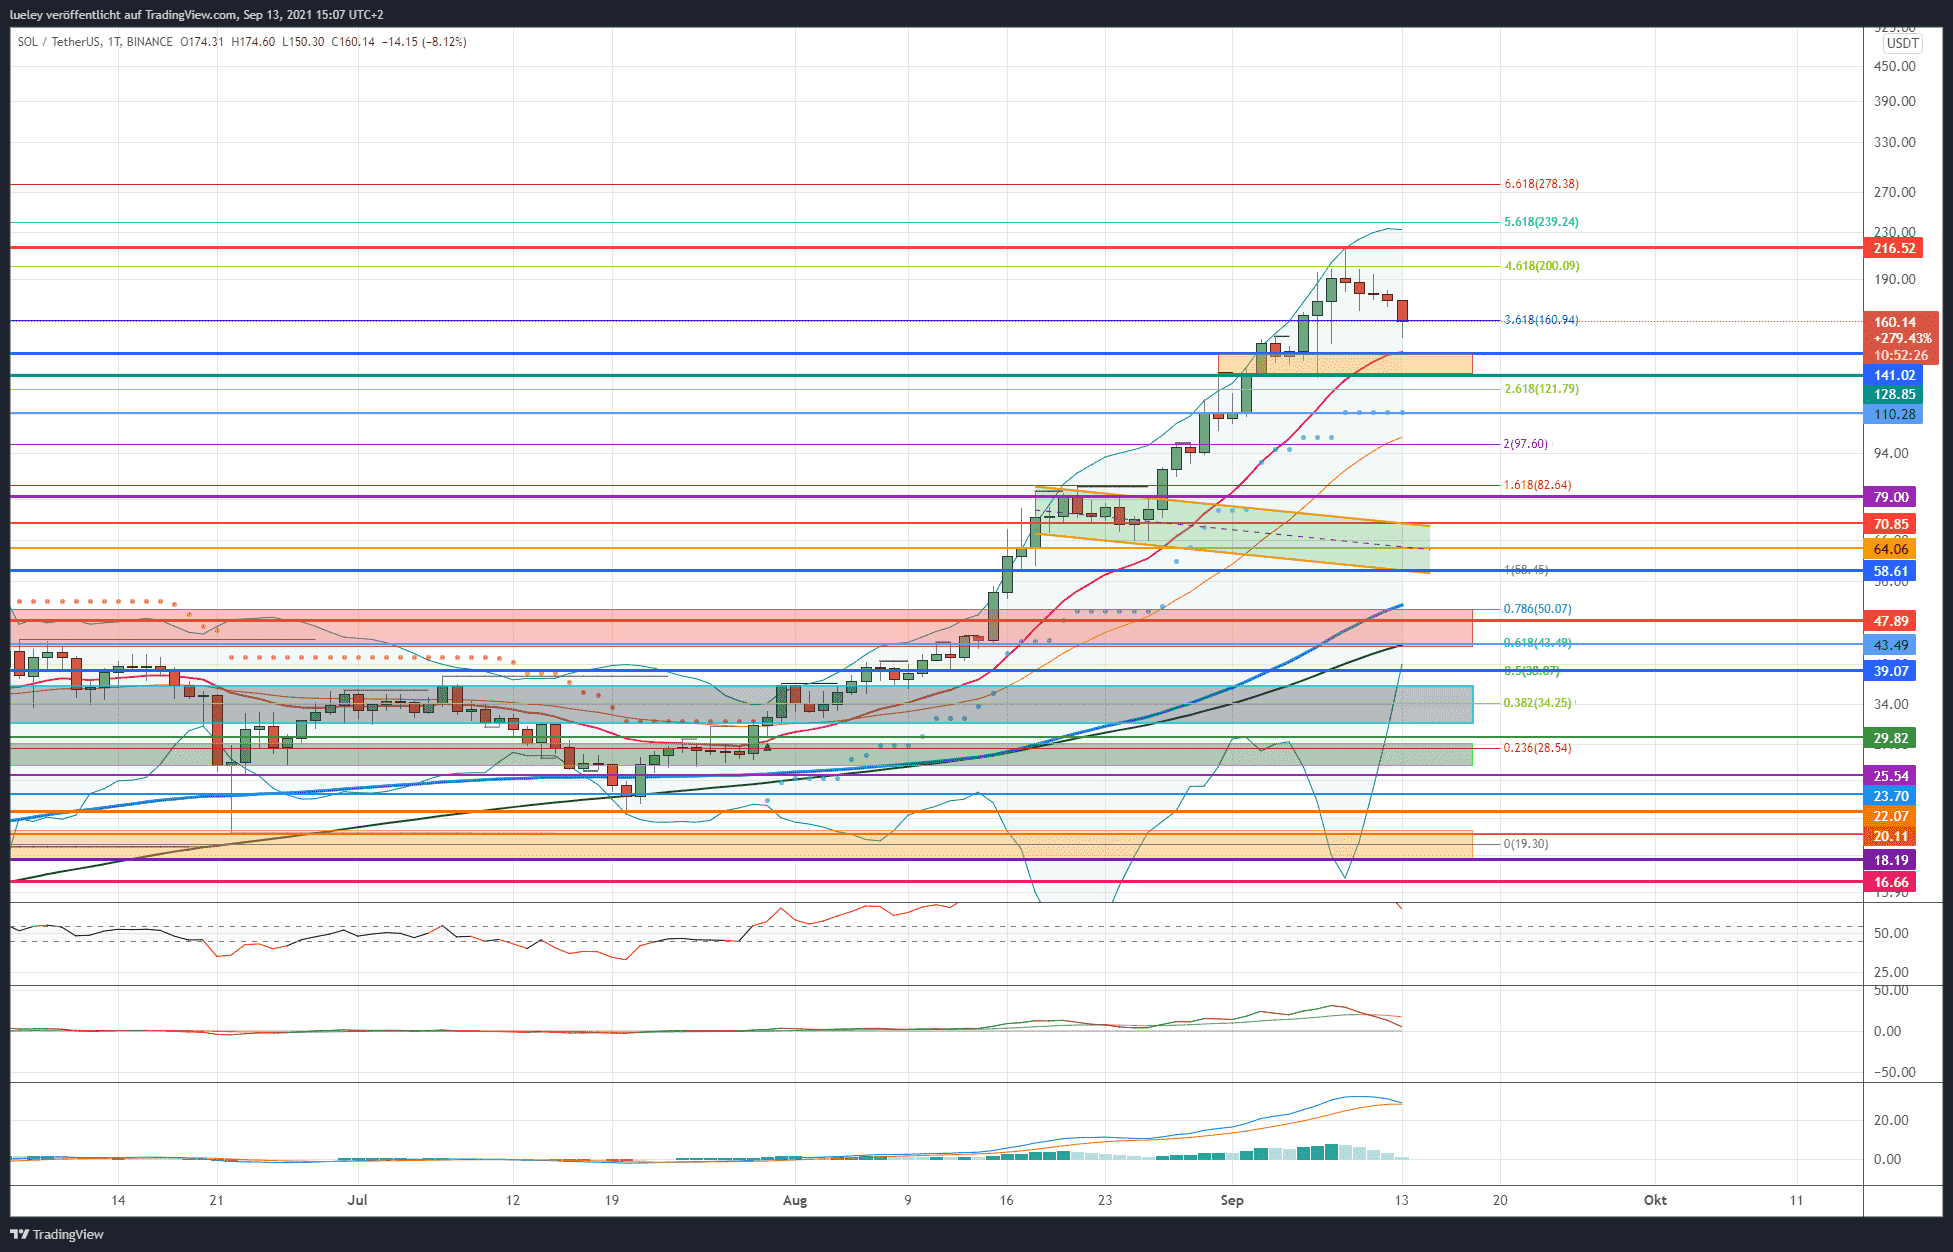
Dogecoin cannot shake off its price weakness of the last few weeks and is currently trading again in the area of the EMA200 (blue) and MA200 (green). After the DOGE price failed to break the upper edge of the purple resistance area, the price fell sharply on September 7, marking a new selling low at USD 0.215. Dogecoin was able to recover slightly in the following days, but is currently trading below the resistance at USD 0.264 at USD 0.235.
Bullish variant (Dogecoin)
As an underperformer, the Dogecoin course is still under selling pressure in recent weeks. This is also noticeable in the loss of space in the top 10 Altcoin ranking. Dogecoin now also has to let Polkadot (DOT) pass after Solana in the previous week. However, the cops are not giving up completely yet. As long as the DOGE price can hold its ground above the EMA200 (blue) at USD 0.229 and does not fall below the lower edge of the blue support zone at the daily closing price, there is still a chance of a renewed rise in the direction of the multiple resistance at USD 0.264. There is a strong horizontal resistance paired with the EMA20 (red) and the EMA50 (orange). If the bulls manage to overcome this chart zone at the daily closing price, another attempt to rise in the direction of the 23 Fibonacci retracement at USD 0.297 is conceivable. The bulls have to prove themselves no later than USD 0.313. In addition to the previous week’s high, the supertrend can also be found here.
The liberation blow
If this price mark is overcome dynamically, the lower edge of the orange resistance area comes into focus. In particular, the USD 0.351 must be broken through sustainably in order to generate further price potential up to USD 0.383. Here the upper edge of the orange resistance zone is paired with the 38 Fibonacci retracement. Only when this resistance has been breached will the next price target be activated in the form of the Fibonacci 50 retracement at USD 0.45. There is also strong horizontal resistance in this area. If the bulls can generate enough momentum as a result, a subsequent rise in the red resistance area should be planned.
The 61 Fibonacci retracement of the current move is on the lower edge at USD 0.520. Profit-taking at this price level should therefore come as no surprise. If Dogecoin can march to USD 0.571 in the medium term and overcome this resistance, the next price target will be activated in the form of the 78 Fibonacci retracement at USD 0.618. The horizontal resist at USD 0.697 is to be seen as the maximum price target for the coming period. Only when this resistance is dynamically broken is an increase to the all-time high at USD 0.743 conceivable.
Bearish variant (Dogecoin)
However, if the DOGE price cannot quickly bail out of the resistance at USD 0.264, a further price decline is likely. If the bears manage to break the EMA200 at the daily closing rate, a retest of the previous week’s low at USD 0.213 is likely. If the overall market weakens in the coming weeks, and Dogecoin corrects sustainably below the blue support area, a relapse into the green support zone should be planned.
Then the DOGE rate could break down to $ 0.195 or even $ 0.175. If the USD 0.175 does not stop either, a correction widening to the July 20 low at USD 0.160 is conceivable. Investors should also use setbacks up to a maximum of USD 0.238 for Dogecoin to make new purchases. If Dogecoin does not stabilize sustainably here and slips below it at the end of the day, a clear setback must be planned. The DOGE rate is likely to drop to at least USD 0.119 as a result. In the medium term, a retest of the old all-time high at USD 0.087 cannot be ruled out.
Indicators (Dogecoin):
The RSI continues to trade below the neutral zone at currently 38 and continues to have a sell-signal active. The same applies to the MACD indicator, which also shows a short signal on a daily basis. The weekly chart also shows a similar picture, the MACD has an active sell signal and the RSI is also tending further south.
Top 10 stability
Looking at the performance of the top 10 altcoins, a highly exciting scenario can be determined. While Bitcoin suffered from profit-taking with a 13 percent decline in price and Ethereum with an 18 percent decline in price, several projects were bullish this week. Terra (LUNA) and Solana (SOL) gain around 8 percentage points. The weekly loser Dogecoin (DOGE), on the other hand, loses almost 25 percent of its value. Also the Binance Chain (BNB) with 21 percent as well as Ripple (XRP) and Cardano (ADA) with 19 percent decline each suffered from profit-taking this week.
The ranking of the ten largest cryptocurrencies shows three changes in position in the past week. Solana overtakes Ripple and jumps to fifth place. Dogecoin continues to lose market capitalization and falls behind Polkadot (DOT) to eighth place. Terra also jumps by two places to ninth place this week and displaces Uniswap (UNI) from the top 10. It turns out that blockchain ecosystems are increasingly romping around among the cryptocurrencies with the largest market capitalizations.
Winner and Loser of the Week
The overall market showed a mixed picture in the past week. In view of the course correction in Bitcoin and Ethereum, this should not come as a surprise. Only around 30 of the top 100 Altcoins show an increase in price. A good ten Altcoins can book a double-digit price increase for themselves. The list of winners is headed by Algorand (ALGO) with a 58 percent price premium. Also strong are Elrond (EGLD) with 57 percent, Harmony (ONE) with 43 percent and Near (NEAR) with 32 percent price increase. After most recently Solana (SOL) and Fantom (FTM), many investors are continuing to invest in different blockchain ecosystems. At the bottom of the top 100 altcoins are many outperformers from the last three weeks of trading. The still young crypto project eCash (XEC) and Bitcoin Cash ABC (BCHA) each lose 34 percentage points. Filecoin (FIL) and Telcoin (TEL) are also weak and lose more than 30 percentage points in value.
Disclaimer: The price estimates presented on this page do not constitute buy or sell recommendations. They are only an assessment of the analyst.
The chart images were created using TradingView created.
USD / EUR exchange rate at the time of going to press: 0.84 euros.