The entire crypto market has come under the wheels in the last few days of trading. Bitcoin (BTC) temporary fallback to 42,500 USD almost without exception causes double-digit price setbacks for Altcoins. Only Terra (LUNA) can escape this trend and form a new all-time high.
Bitcoin’s massive price discount at the beginning of the weekend buries the hope of many investors for a year-end rally, which they believed to be safe. The key crypto currency followed the weakness of the technology exchange Nasdaq, which also had to struggle with significant price setbacks at the end of the week on Friday. In addition to the fear of the new Corona variant Omicron, the announcement by Fed chief Jerome Powell that he would end bond purchases more quickly and prefer a rate hike is also putting pressure on the entire financial market. It is currently evident that the crypto sector is not viewed by investors as a safe haven against escalating inflation, but continues to be viewed as a high-risk investment. Investors should observe the development of the classic financial market in the coming trading weeks in order to determine possible entry levels for Bitcoin and Altcoins.
Best price development among the top 10 Altcoins:
Terra (Luna)
Course analysis based on the value pair LUNA / USD to Binance
Terra was able to defy the sell-off on the overall market and hit a new all-time high on the weekend. Although the LUNA rate is also tending slightly south this Monday morning, Terra shows a remarkable increase in value of more than 25 percentage points on a weekly basis.
Bullish variant (Terra)
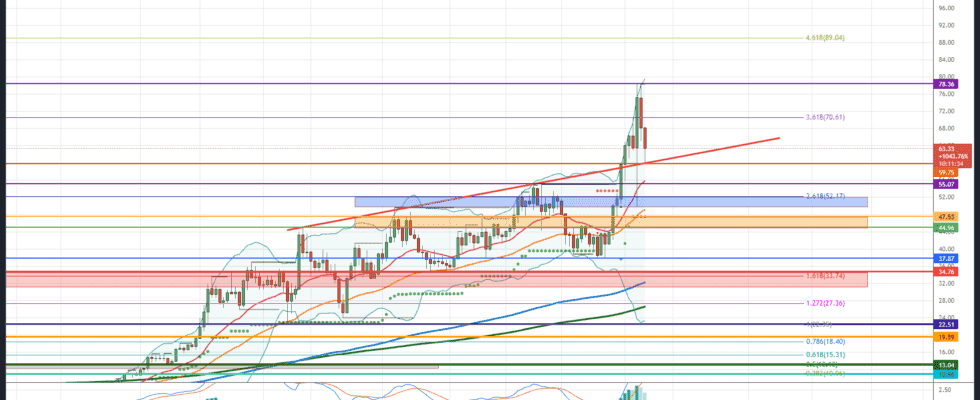
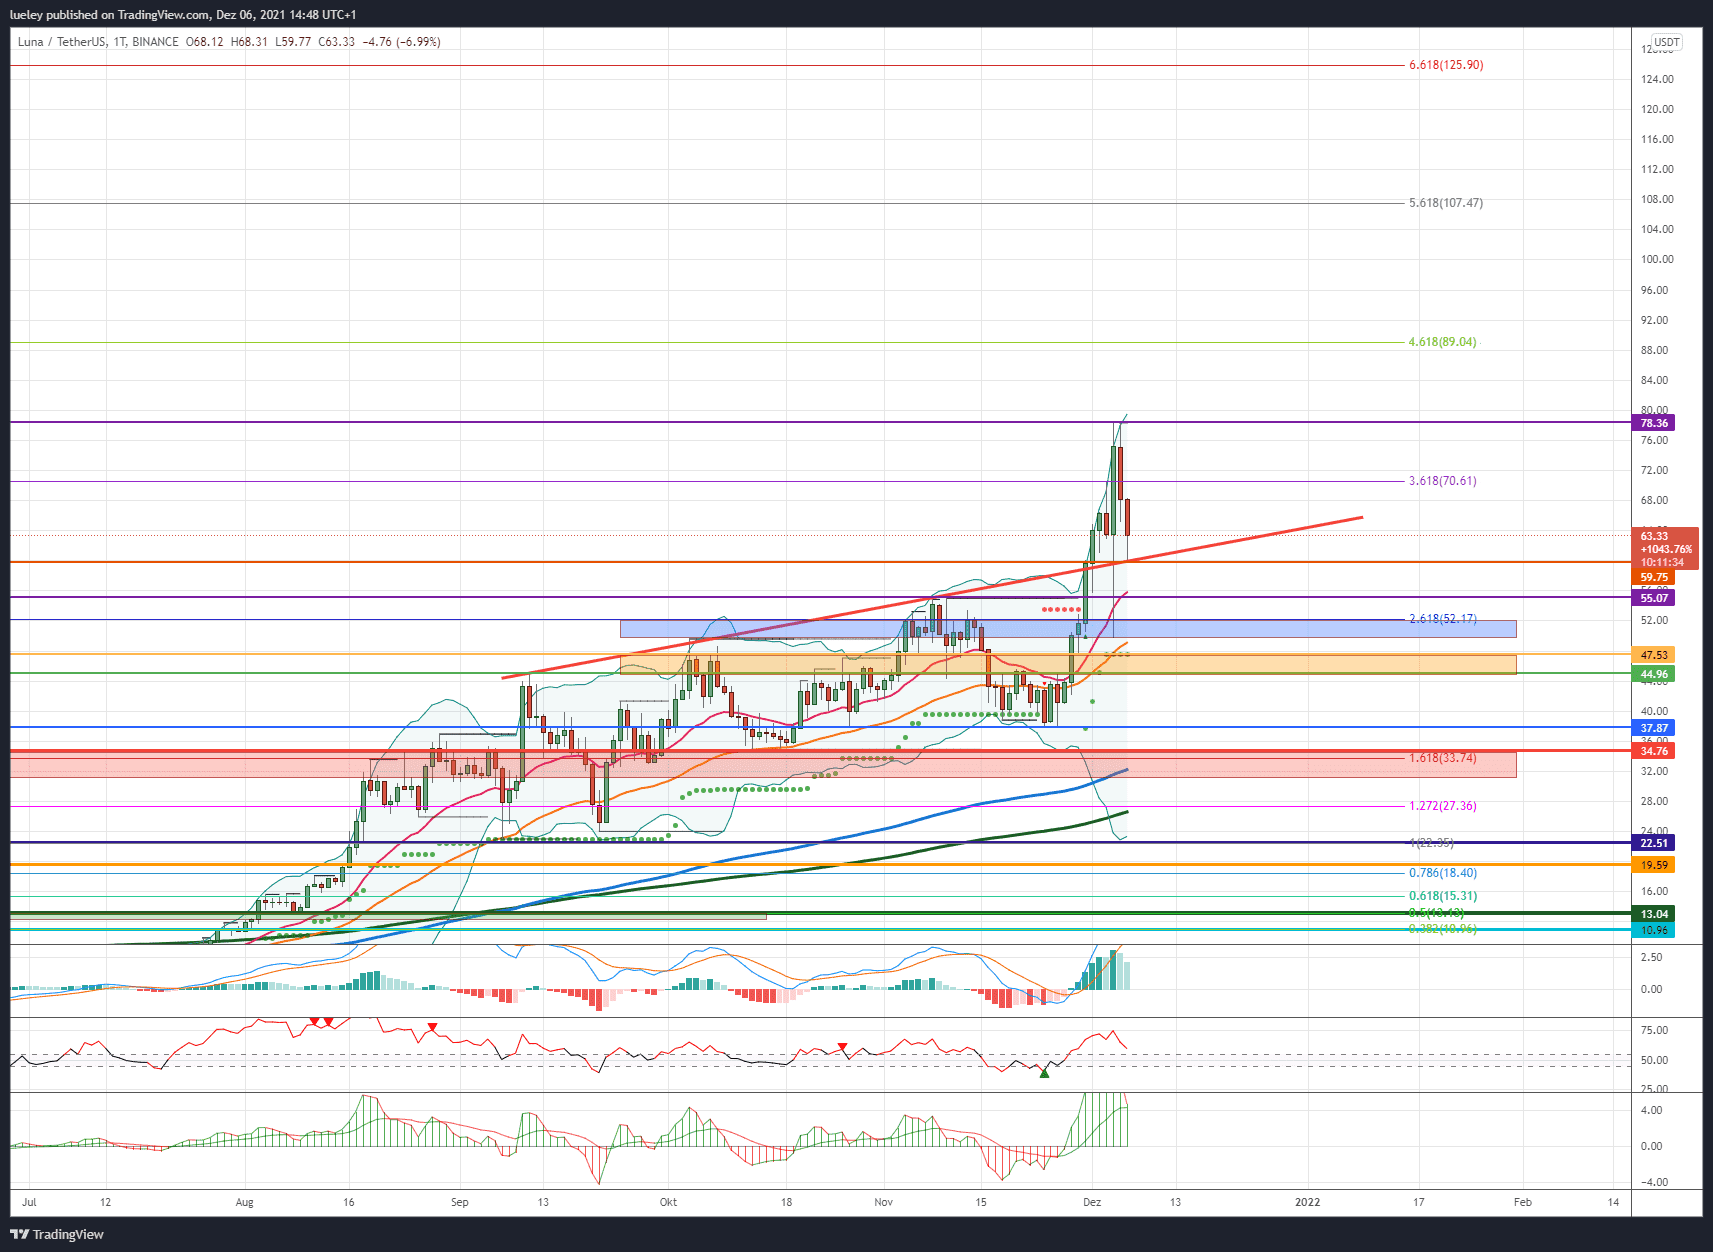
Despite the significant correction on the crypto market, the LUNA price continues to show its bullish side. Despite the intermittent price setback in the early morning of December 4th back into the support area at USD 49.77, Terra can continue to outperform the overall market and rise to a peak of USD 78.36. Although the LUNA rate came back again this Monday morning to the support at USD 59.75, it initially rebounded northwards and was trading at USD 63.33 at the time of this analysis. If Terra succeeds in stabilizing above its breakout level at USD 44.96 in the coming weeks and subsequently rising back above USD 70.61 towards the all-time high, the perspective of the Fibonacci 461 extension at USD 89.04 will come into focus the investor.
For this, however, a stabilization of Bitcoin and thus of the entire crypto market would be an advantage. Despite its price strength, Terra will not be able to permanently oppose a correction in the market as a whole. If the crypto market rallies in the coming trading weeks, a long-term march through to the next price target of USD 107.47 is conceivable. If the LUNA rate does not drop significantly here and stabilizes above USD 78.36, an increase to the maximum target price of USD 125.90 cannot be ruled out. This target mark is derived from the 661 Fibonacci extension.
Bearish variant (Terra)
If, on the other hand, the weakness in Bitcoin continues and the LUNA price slips back below the cross support at USD 59.75, a retest of the area around USD 55.07 is initially likely. The EMA20 (red) is currently also running in this zone. However, even a direct setback into the blue support zone should not come as a surprise. Only when the bears manage to push the LUNA price back below this zone will the correction expand further and target the supertrend at 47.53 percent. Again, resistance from the buyer side is to be expected. However, if the price does not turn north here and subsequently falls below the support at USD 44.96, the chart image at Terra also darkens for a short time. Then an expansion of the correction up to USD 37.87 should be planned.
A price ricochet is to be expected here at the first attempt. If the LUNA course also gives up this support, a directional decision is made in the red support area. The EMA200 (blue) is currently between USD 34.76 and USD 31.17. If, contrary to expectations, the bears manage to break through this area, the correction extends immediately to USD 27.36. In addition to the 127 Fibonacci extension, the MA200 (green) can also be found here. If the bulls do not come back on the floor in this area and Terra continues to correct, a relapse to the maximum bearish price target of USD 22.51 cannot be ruled out in the medium term. This important support level represents the breakout level of the current upward movement. As long as Terra does not dynamically drop back below the blue support zone, price setbacks can still be used for new entrants.
Indicators (Terra)
The RSI as well as the MACD indicator are currently trending slightly south, but continue to show stable buy signals. As long as the RSI indicator does not fall back into the neutral zone between 45 and 55, the bullish scenario is to be preferred with regard to the indicators.
Worst price development among the top 10 altcoins:
Avalanche (AVAX):
Course analysis based on the value pair AVAX / USD on Binance
Avalanche is currently also having to give up after its six-week course rally, which caused the AVAX price to rise by 150 percent. Starting from the all-time high at USD 147.28, the AVAX price corrected by almost 50 percent in the last 14 trading days to the area of the old high at USD 77. Exactly at the 38 Fibonacci retracement at USD 76.17, the Avalanche rebounded north several times, trading at USD 81.40 but below the first relevant resistance at USD 83.52.
Bullish variant (Avalanche)
The bulls have to do everything in the short term to defend the green support area in order to preserve new opportunities for growth. If the bulls succeed in making the AVAX price rise back towards the red resistance zone, the USD 94.50 mark must be conquered promptly at the daily closing price. If this price level is overcome dynamically and thus also the EMA50 (orange), the focus will initially be on the cross resistance at USD 103.32. The 61’s Fibonacci retracement runs here, paired with the EMA20 (red). Only when this area is broken will the next target price be activated at USD 122.66.
However, Avalanche is also dependent on a stabilization of the overall market. If the 78 Fibonacci retracement is regained and the supertrend at USD 126.21 is skipped as a result, a retest of the all-time high should be planned. In order to sustainably overcome the area around USD 147.28, Bitcoin must also recapture the USD 54,000 mark. Avalanche could then aim for higher price targets between USD 178.47 and USD 191.47 in the medium term. For the coming months, the maximum price target on the upside is USD 218.40. This resistance level is derived from the Fibonacci 161 extension of the trend movement.
Bearish variant (Avalanche)
However, if the bears manage to cap the AVAX price below the red resistance area, the green support zone will once again come into focus. If the bulls give up this support area at the daily closing price, the correction expands immediately to USD 67.56. Again, increased resistance from the bull camp is to be expected. Should the overall market continue to consolidate, a correction to the USD 59.11 area is also conceivable. Here is a strong multiple support level from the old all-time high, 23-Fibonacci retracement and EMA200 (blue).
An immediate fallback to USD 51.41 should only be planned for when this support brand is also given up significantly at the daily closing rate. The trend low from October 2021 can be found here. If, contrary to expectations, there is a sustained breakthrough in this zone, the correction initially expands to the MA200 (green) at USD 45.55. If Avalanche breaks through this strong sliding support line, a relapse into the orange support zone is likely. A fall below $ 37.50 would cloud the chart further. As a result, the AVAX price could approach the maximum bearish price target at USD 32.21. At this price level at the latest, bullish investors will stabilize the AVAX price in order to preserve their chances of a new price rally.
Indicators (Avalanche):
Both the RSI and the MACD indicator are now showing sell signals. As long as the RSI is below the threshold of 45, investors should wait for Avalanche to stabilize.
Stability of the top 10
The significant price correction of the crypto key currency Bitcoin also resulted in a significant drop in prices among the top 10 Altcoins. Only the returnees among the top 10, Terra (LUNA), can currently escape the bearish trend and increase in value by 27 percent on a weekly basis. It is also noteworthy that Ethereum (ETH), the Binance Coin (BNB) and Solana (SOL) can assert themselves better than Bitcoin and only correct seven to nine percentage points. The list of weekly losers is headed by the outperformer of the last trading weeks Avalanche (AVAX) with a 28 percent price correction. It is followed by Polkadot (DOT) with a 27 percent decline in share price.
Dogecoin (DOGE), Ripple (XRP) and Cardano (ADA) are also weak, each dropping around 20 percentage points in value. Terra’s outperformance also shook the rankings of the ten largest cryptocurrencies. Terra rose by four rankings to eighth, overtaking Avalanche, Dogecoin and Shiba Inu (SHIB). The meme coin Shiba Inu has fallen back to 11th place among the top 10 altcoins after a long time.
Winner and Loser of the Week
Bitcoin’s significant relapse back below the psychological USD 50,000 also caused a sell-off on the overall market. Only five top 100 Altcoins show a price increase in a weekly comparison. In addition to Terra, Polygon (MATIC) and the LEO Token (LEO) can hold their own relatively well. All three cryptocurrencies show a price increase of eight percentage points. Also stacks (STX) and the OKB Coin (OKB) of the crypto exchange OKex show a slight price increase of five percentage points each. The long list of underperformers is led by Kadena (KDA) with a 47 percent drop in price. This is followed by Harmony (ONE) and Gala (GALA) with 38 percent each.
THORChain (RUNE) and The Graph (GRT) also fell significantly in value with 37 percent price slide each. More than half of the top 100 altcoins are sliding south by more than 20 percentage points. This price development underpins the dependence of alternative cryptocurrencies on Bitcoin. Only when the Bitcoin course can develop a sustainable base can a recovery also be planned for the Altcoins.
Disclaimer: The price estimates presented on this page do not constitute buy or sell recommendations. They are only an assessment of the analyst.
The chart images were created using TradingView created.
USD / EUR exchange rate at the time of going to press: 0.88 euros.