
Bitcoin breaks out of the sideways range and reaches a new all-time high not far from the psychological USD 70,000 mark. BTC dominance can also break away from its weekly lows in the last few days of trading.
Bitcoin (BTC): Breakout from sideways phase leads to new highs
BTC course: 68,161 USD (Previous week: 62,050 USD)
Resistance / goals: $ 68,568, $ 70,856, $ 76,472, $ 77,678, $ 85,563, $ 87,090, $ 89,982, $ 100,259, $ 114,961
Supports: $ 67,416, $ 64,896, $ 63,471, $ 61,771, $ 59,518, $ 57,998, $ 55,817, $ 54,077, $ 53,005, $ 51,307, $ 49,555, $ 48,222, $ 47,070, $ 45,292, $ 42,855, $ 40,585, $ 39,240
After 19 days of consolidation, the Bitcoin price broke out at the beginning of the week and reached a new all-time high at USD 69,000 in the last few minutes of trading. The upward trend is therefore still fully in step and should lead Bitcoin to the first important price target at USD 70,856 in the coming trading days. On the downside, Bitcoin is well hedged in the area of the yellow support zone between $ 64,896 and $ 63,471. Overall, the USD 57,998 mark continues to act as a strong support level. The implementation of the Taproot update on November 15th could also spark new course fantasies. This soft fork is intended to make the Bitcoin network more efficient and transactions more private. The inflation rate of 6.2 percent published a few minutes ago in the USA should also give Bitcoin and Co. a further boost.
Bullish scenario (Bitcoin price)
At the beginning of the week, investors heaved the Bitcoin price back above the old all-time high of USD 64,896, thereby breaking the sideways range of the last three weeks of trading. As a result, the BTC rate rose to a new high of $ 69,000 on Wednesday, November 10th. As long as the course is now stabilizing above the yellow support, the gaze is directed further north. Right now it is only a matter of time before the next key price target is hit at USD 70,856.
If there is no significant profit-taking here either and Bitcoin can get stuck above the psychological USD 70,000 mark in the near future, the next relevant target range between USD 76,472 and USD 77,678 will move into the focus of investors in perspective. Once again, investors will want to reap profits here. However, as long as the Bitcoin price does not break off more clearly and fall sustainably below USD 70,000, the chances of a subsequent increase to the target zone between USD 87,090 and USD 89,982 in the coming months are still good. If the bulls manage to overcome this strong resistance area at the daily closing price, Bitcoin should target the 361 Fibonacci extension at USD 100,259 as an important target. At the latest in the area of 100,000 USD, more profit-taking will begin. In the long term, a price increase up to the overarching price target of USD 114,961 (Fibonacci 461 extension) is still conceivable.
Bearish scenario (Bitcoin price)
The bears have to give up again for the time being. Only when the seller succeeds in selling the BTC rate back below the yellow support area and also dynamically undercutting the EMA20 (red) at the daily closing rate, the support at USD 61,771 will come into focus again as a target. If this support is abandoned, the correction will initially expand to the top of the red support zone at USD 59,802. Not far below there is strong support with the supertrend. If this is undercut, a directional decision is made at the cross support at USD 57,998. In addition to the low on October 28, the EMA50 (orange) also runs here. The buyer side is likely to do everything in its power to defend this price level.
Conversely, should the bears pulverize the support at USD 57,998 this time around, an immediate relapse to USD 55,817 is likely. If there is no resistance from the bulls here either, investors will focus on the orange support area between USD 54,077 and USD 53,005. This zone represents the breakout level of the current trend movement. Bitcoin should rebound northwards here if possible in order to avert a clearer correction expansion into the blue support zone between USD 51,307 and USD 49,555. If the Bitcoin rate falls below this support range at the daily closing rate, the correction expands to USD 48,222.
The end of the upward trend threatens here
If possible, this price mark should not be given up. Since the EMA200 (blue) is currently in this area, a direct breakthrough is very unlikely. A setback below this would clearly endanger the current bullish trend movement. If, contrary to expectations, Bitcoin falls below this strong support level, the probability of a correction widening increases. Then the next target price at USD 47,070 comes into focus. If the bulls give up the green support zone on a sustained basis, the correction extends immediately to USD 45,292. The MA200 runs here (green).
Falling below this price level clouds the chart image instantly in favor of the seller. Then the correction will gain momentum and Bitcoin will give way to USD 42,855 or even USD 40,585. The low here from September 2021 should represent a good entry level for many investors. The maximum bearish price target can still be seen in the USD 39,240 area. If this zone is also given up on a sustained basis by USD 40,000, further massive price losses in the direction of USD 30,000 are to be expected. Furthermore, the zone around USD 48,222 must be defended by the bulls in order not to jeopardize the overall upward trend.
Bitcoin dominance: important support level can be defended
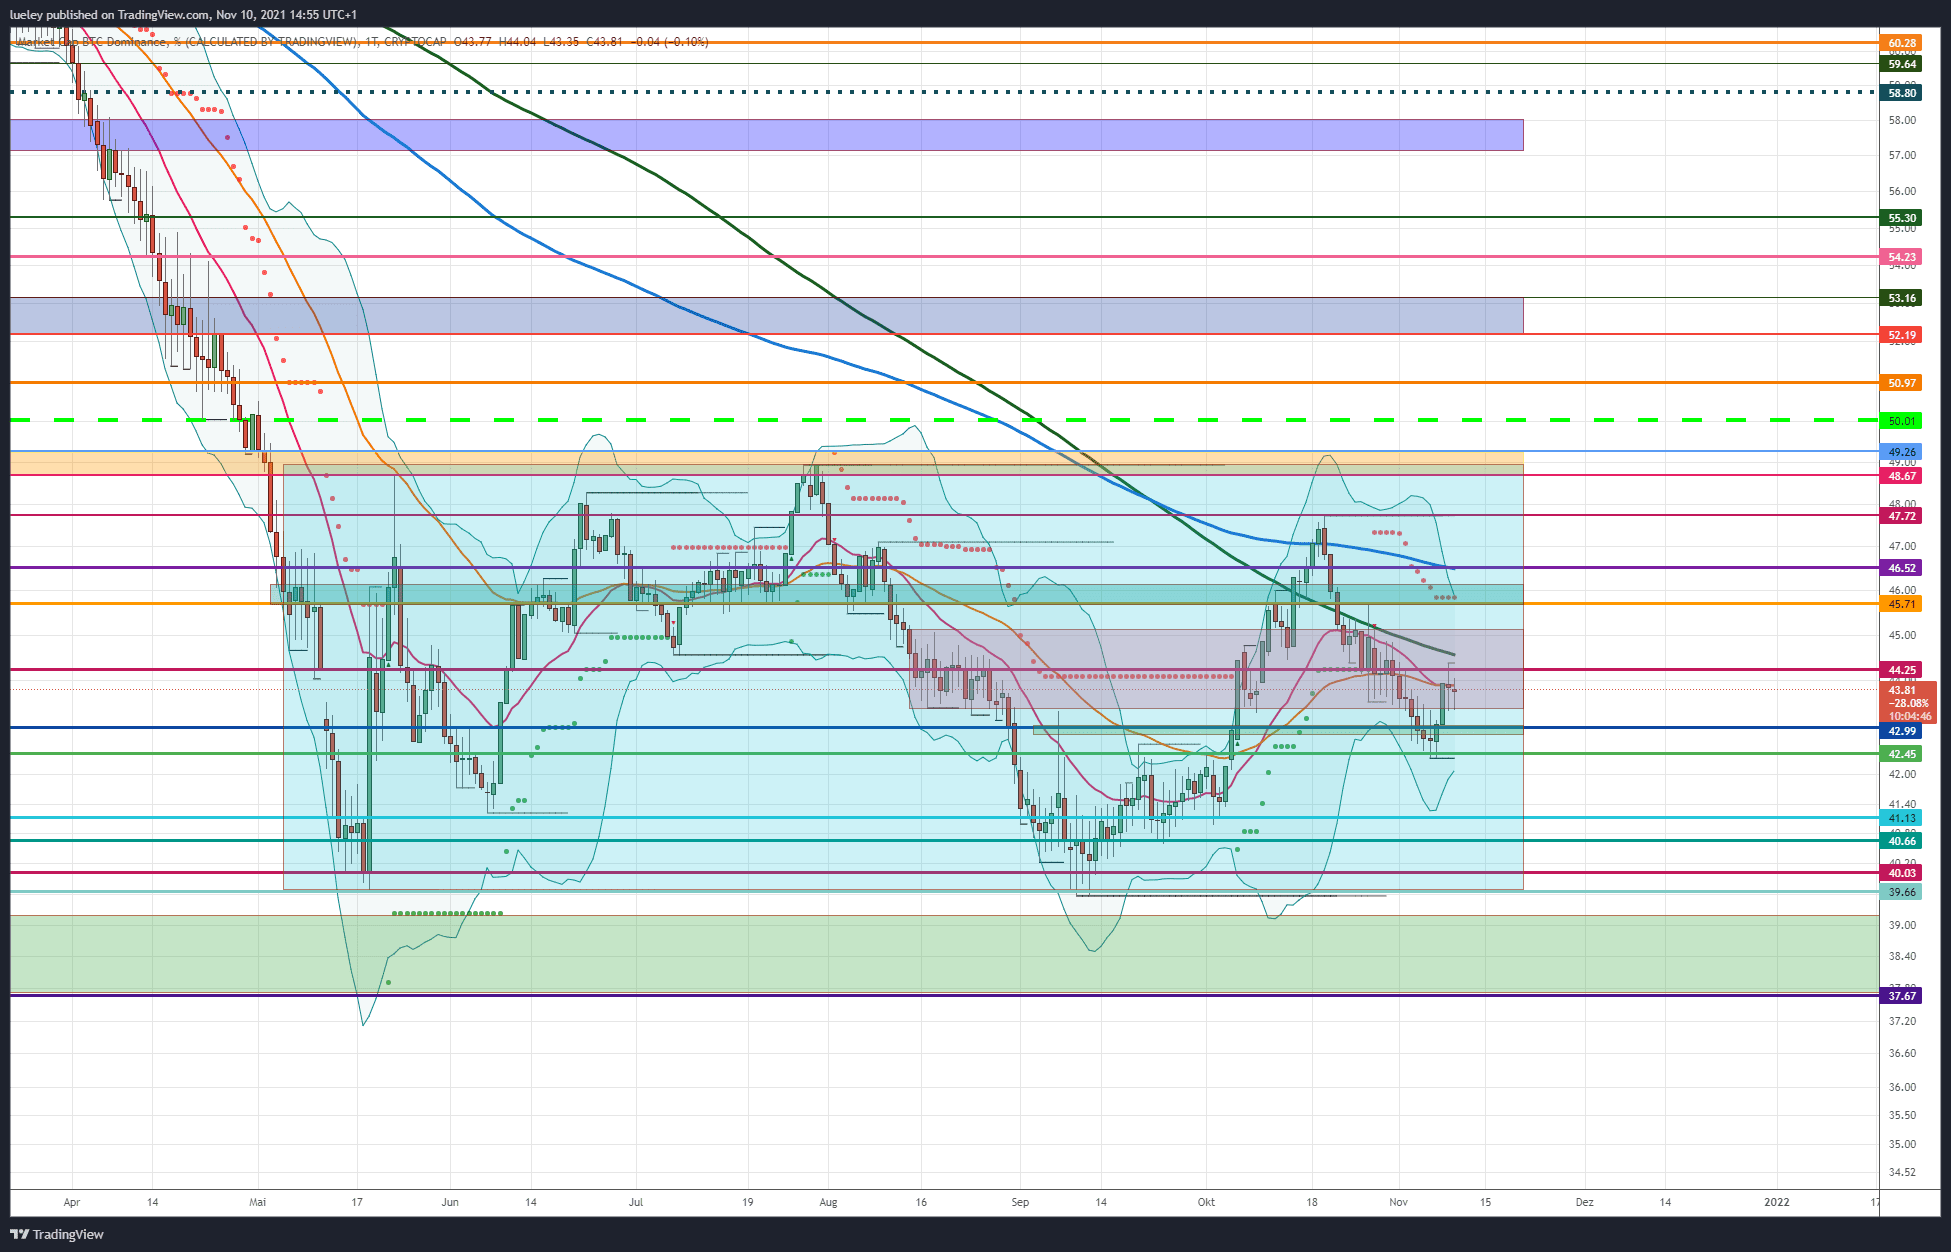
Bitcoin dominance based on values of Cryptocap shown
After a relapse to the breakout level at 42.45 percent last weekend, the BTC dominance can increasingly recover in the last few days and rise back to the resistance level at 44.25 percent. If the Bitcoin dominance succeeds in stabilizing above this price mark and also breaks through the MA200 (green), currently running at 44.58 percent per day’s closing price, a subsequent increase towards 45.71 percent should be planned.
BTC Dominance: Bullish Scenario
In the last few days of trading, the breakout mark from October 5 was retested at 42.45 percent, which we were able to defend for the time being. Today, Wednesday, the dominance of the crypto currency can increase further north and is again trading in the area of the two moving averages EMA20 (red) and EMA50 (orange). Should the strong resistance at 44.25 percent be overcome in a timely manner, the upper edge of the red box at 45.05 percent will first come into focus. This would mean that the BTC dominance would again be listed above the MA200 (green). A subsequent increase up to the strong resist at 45.71 percent is then probable. In addition to the supertrend, the upper Bollinger Band also runs just above it at around 46.00 percent. This resistance zone is unlikely to be broken at the first attempt.
If the market dominance of Bitcoin manages to break through the blue resistance area, a breakthrough to the EMA200 (blue) at 46.52 percent is conceivable. If this resistance level is also broken, investors will focus on the trend high of 47.72 percent as the target. If the BTC dominance continues to gain momentum in the coming trading weeks, the chart will brighten significantly and an increase into the orange resistance zone would be increasingly likely. The increase target between 48.67 percent and 49.26 percent will initially continue to function as a medium-term price target. A breakout above the high of July 30, 2021 could end the sideways movement that has been going on since May. This brings the range between 50.00 percent and 50.97 percent back into focus as the target range. This means that the BTC dominance could target the gray resistance area between 52.19 percent and 53.16 percent in the long term.
BTC Dominance: Bearish Scenario
If, on the other hand, the BTC dominance rebounded significantly south in the area of 44.25 percent and also surrendered the area around 43.90 percent, a renewed correction of up to 42.99 percent is likely. If there is no significant trend reversal, a decline back to the low of 42.45 percent should be planned. If the correction then extends further, a relapse to the October low of 41.13 percentage points is also conceivable. Here the Bitcoin bulls should do everything possible to stabilize the course in order to avert a correction widening up to 40.66 percent.
If Bitcoin dominance continues to trend bearish in the coming trading weeks, the probability of a retest of the 40 percent mark increases significantly. Persistent weakness could subsequently lead Bitcoin dominance to its annual low of 39.66 percent. A sustained fall below the annual low would have a signal effect. The chance of a correction of up to 37.67 percent would increase significantly. This scenario should benefit the altcoins and ideally lead to an altcoin rally.
Disclaimer: The price estimates presented on this page do not constitute buy or sell recommendations. They are only an assessment of the analyst.
The chart images were created using TradingView created.
USD / EUR exchange rate at the time of going to press: 0.86 euros.