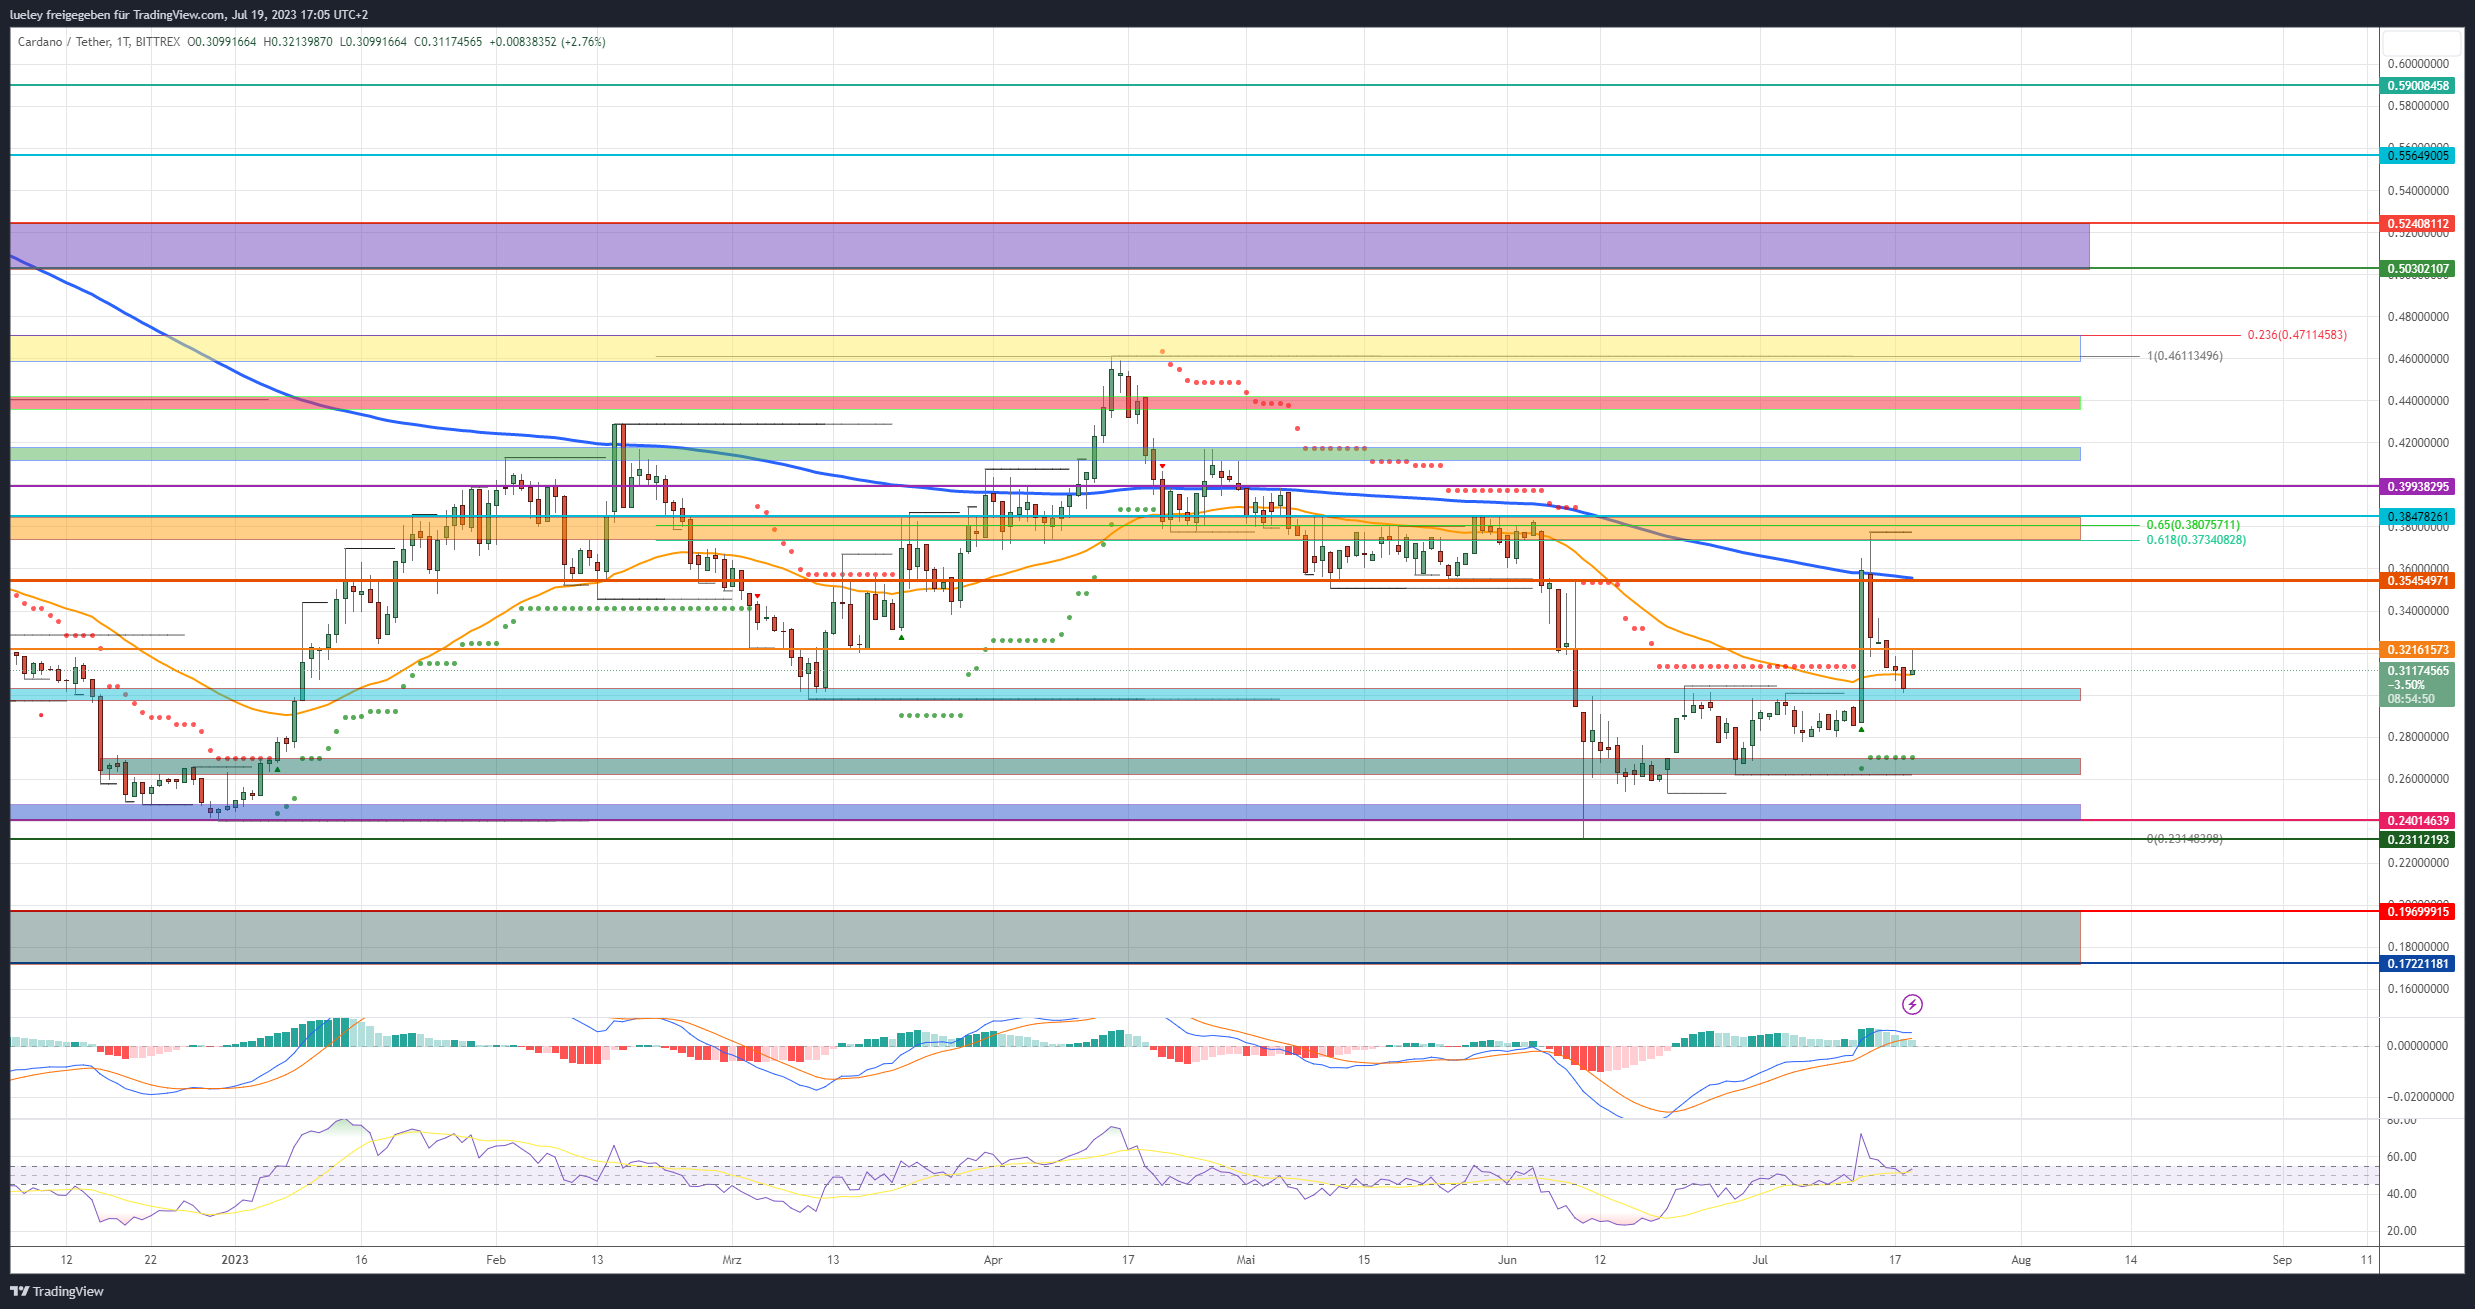
Since the last Cardano price analysis on July 12, the ADA price Cardano has been able to initiate a remarkable price rally. In the course of the court decision between Ripple and the Security and Exchange Commission (SEC), Cardano jumped to the top of the orange resistance area above $0.373 and thus reached the first important price target in the form of cross-resistance from Golden Pocket and the old stall. However, the buy side subsequently failed to confirm stabilization above the EMA200 (blue). In the days that followed, ADA corrected back to the key breakout level in the turquoise zone at $0.303. Here the bulls plucked up courage again and heaved Cardano back above the EMA50 (orange). If stabilization above this floating resistance is successful and the horizontal resist at 0.321 US dollars is quickly overcome again, the chart image will continue to brighten in the short term. However, a bullish trend reversal can only be spoken of with a sustained break of 0.382 US dollars.
Cardano: Bullish price targets for the next few weeks
Bullish price targets: $0.321, 0.354 USD, 0.373/0.384 $0.399, $0.413/0.417, $0.435/0.441, 0.462/0.471 USD, 0.503/0.524 $0.556, $0.590
The bull camp is alive. A first important hurdle seems to have been overcome. If Cardano can break through the $0.321 mark in a timely manner, a new attack towards $0.354 can be expected. For this, however, the Bitcoin course must also defend the important support mark at 29,847 US dollars. Only when the buyer side can recapture the EMA200 at the daily closing price does the probability of a timely trend reversal increase significantly. If this plan succeeds, the previous week’s high will come back into focus. A breakout of the make-or-break zone between $0.373 and $0.384 would be considered a key point win for the bulls.
Do you want to buy cryptocurrencies?
If the interim high of May 29 at US$0.399 can subsequently be breached, the trend movement will expand into the area between US$0.413 and US$0.417. This will decide whether a fresh run towards the April 19 stall line at $0.436 can be made. If the buyer side generates enough buying momentum, the annual high at 0.462 US dollars will come into the focus of investors. Investors should realize their first profits here.
However, if the bulls stay on the trigger and break through the 23rd Fibonacci retracement at $0.471, there will be new price potential towards the interim high from September in the purple zone between $0.503 and $0.524. If this area can also be pulverized in the medium term, the maximum rise targets for the coming weeks will be activated at US$ 0.556 and US$ 0.590.
Cardano: Bearish price targets for the next few weeks
Bearish targets: 0.303/0.297 USD, 0.270/0.262 USD, 0.247/0.240 $0.231, $0.196, $0.172
Although the ADA price has meanwhile risen by 28 percent in the course of the temporary price explosion, it has not yet been enough for a sustainable change in the market structure. The bears were there and pushed the course back into the turquoise zone. Here, the buyer side took over the helm again for the time being. To initiate another sell-off, the sell-side needs to generate the ADA price a daily close below the EMA50 and optimally push the price just below the turquoise area between $0.303 and $0.297.
The probability of a renewed retest of the support zone between US$0.270 and US$0.262 would then increase significantly. However, resistance from the buyer side is to be expected at this cross support of horizontal support and supertrend in the daily chart. However, if Cardano slips below this support zone at the daily closing price, a correction extension of the ADA price in the direction of the blue support area between USD 0.247 and USD 0.242 should be planned.
Even a spike to the yearly low of $0.231 would not be surprising. The bulls are likely to make a new entry here and try to form a double bottom. If Bitcoin weakens in the next few weeks and slides southwards more sustainably, the Altcoin sector and with it the ADA rate should come under pressure again, and a fall back into the gray zone between US$ 0.196 and US$ 0.172 should not be allowed be excluded.
Looking at the indicators
The RSI initially shot north to a value of 72 in the previous week, but fell back into the neutral zone to currently 54 in the following days. Now it is important to generate a fresh buy-signal by breaking out again above the threshold of 55. The MACD indicator, on the other hand, was able to activate a new long signal by recapturing the 0 line. In the short term, this can be seen as positive. Looking at the weekly chart, the RSI was also able to gain some traction, but with a value of 44 it is still below the neutral zone. A bounce back into the 45-55 area would ease selling pressure across the board. It was also able to make up ground on a weekly basis and is trending slightly north again. However, the MACD indicator is still a good way away from a fresh buy signal at the weekly level.
Disclaimer: The price estimates presented on this page do not represent buy or sell recommendations. They are merely an assessment by the analyst.
The chart images were created using TradingView created.
USD/EUR exchange rate at the time of going to press: EUR 0.89.
The latest issues of BTC-ECHO Magazine
You might also be interested in this