The entire crypto market has to cope with another setback after a mixed week before. Shortly before the weekend, the bad news of a ban on transactions in cryptocurrencies in China caused a sale on the overall market.
After an intermediate recovery during the week, the overall market is losing value again after headlines about an expansion of the crypto ban in China. On average, the 100 largest altcoins correct a good 12 percentage points. With Huobi (HT), OKX (OKB) and the Binance Coin (BNB) are losing significantly in value, especially crypto exchanges operating in China. It remains to be seen how sustainable these price reductions will be for the three large Asian crypto exchanges.
Best price development among the top 10 altcoins:
Terra (LUNA)
Price analysis based on the value pair LUNA / USD to Binance
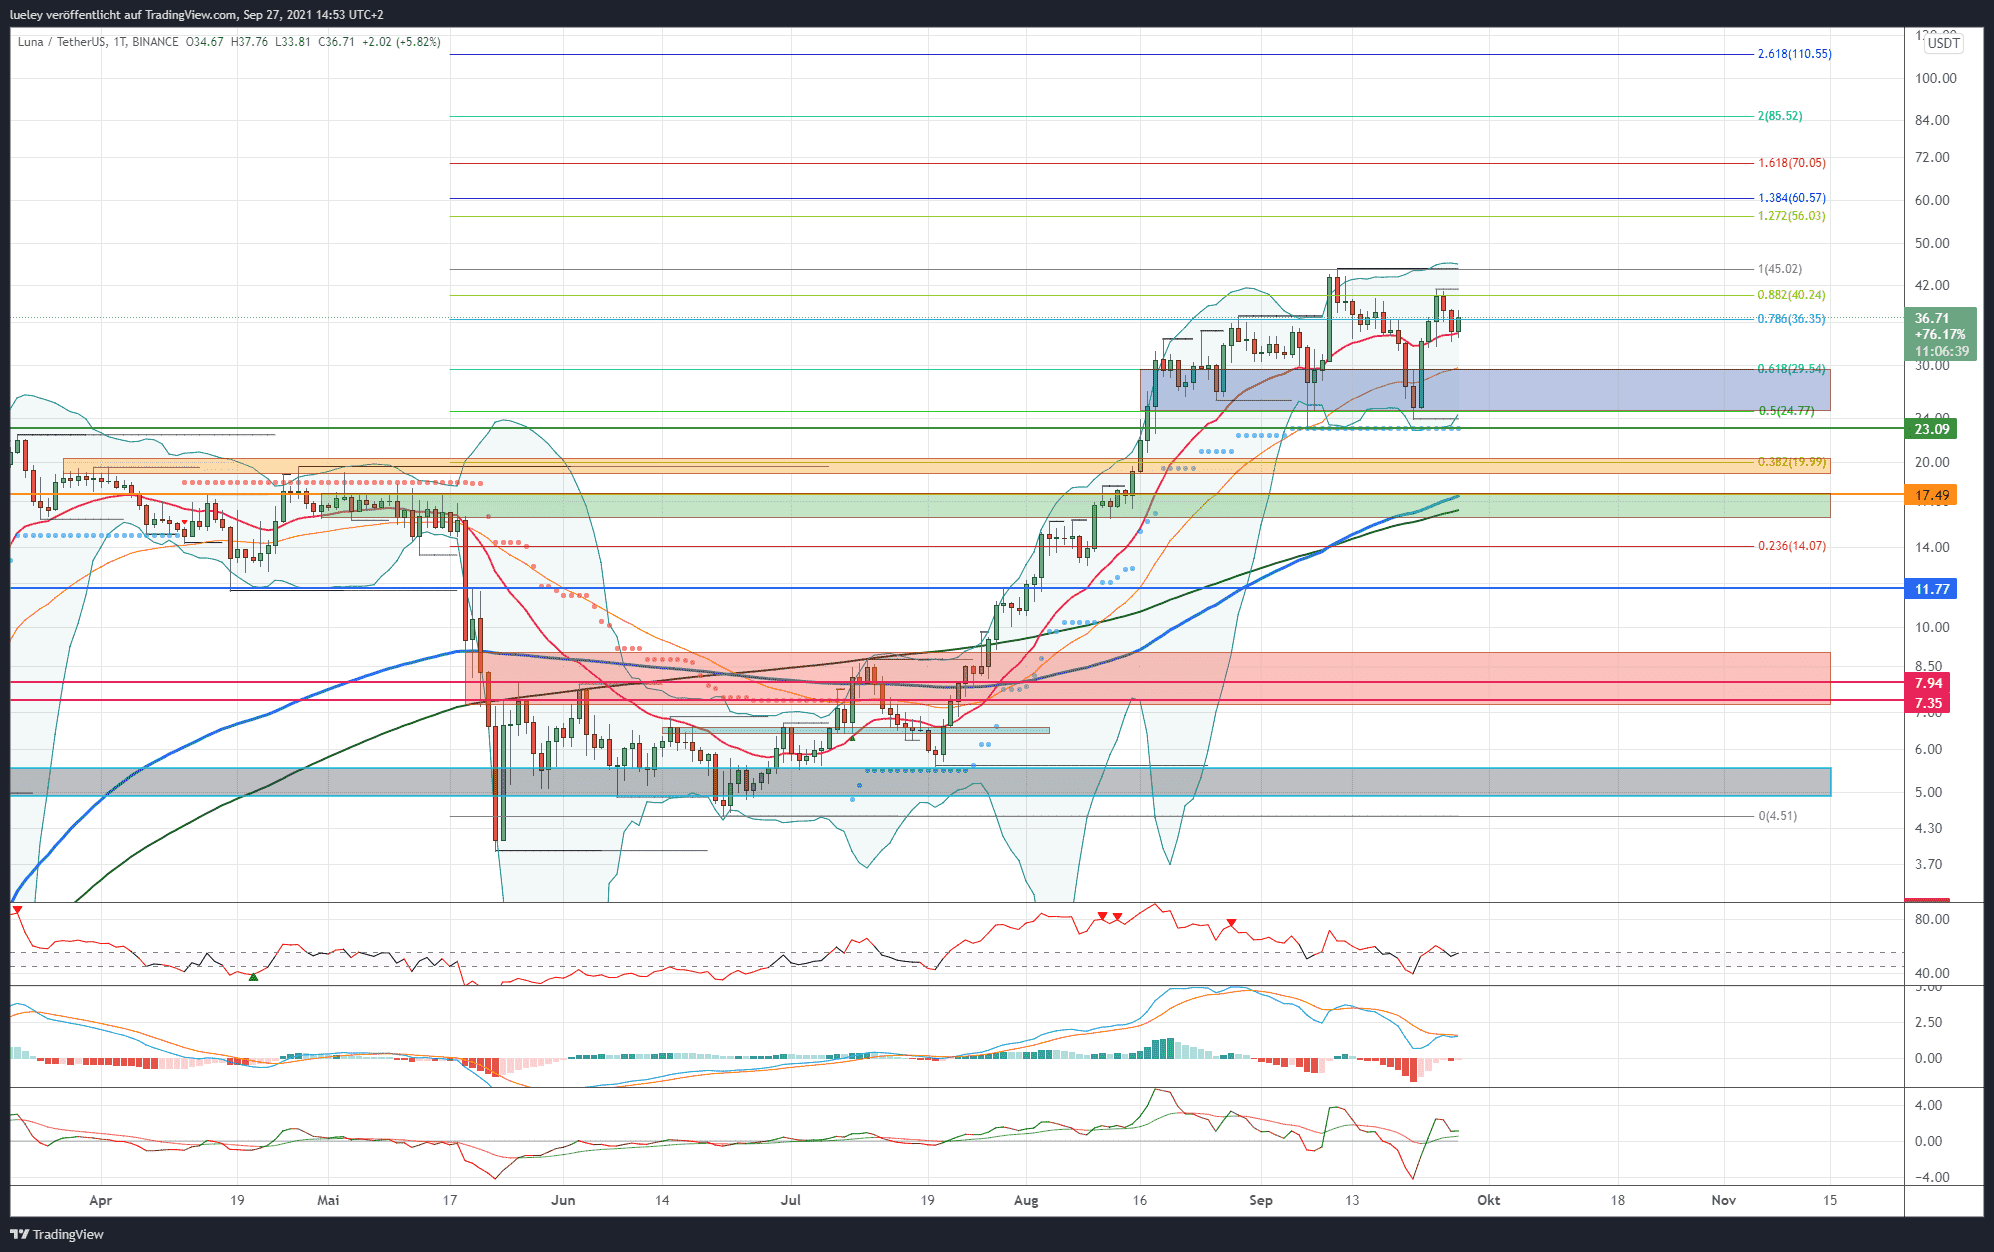
Terra has been able to stabilize again after the significant sell-off in the previous week and is currently trading again within reach of its all-time high at USD 36.71. The recapture of the EMA20 (red) indicates that the bulls are willing to buy. However, since the upper Bollinger Band can also be found in the area of the all-time high at USD 45.02, Terra could enter a sideways phase for the time being. A sustained eruption should only succeed with enough momentum.
Bullish variant (Terra)
After taking profits in the last week of trading, the LUNA price can bounce back and fight back above its EMA20 starting from the low at the 50s Fibonacci retracement. If the bulls manage to stabilize the price above the EMA50 (orange) at USD 29.54 in the coming trading days, a renewed attempt at the all-time high can be expected. First, however, the Fibonacci 88 retracement at USD 40.24 must be broken. In the area of USD 45.02, the upper Bollinger band is currently also running, which should have a short-term price-limiting effect.
The bulls’ goal must now be to allow Terra’s price to rise dynamically above USD 45.02 in the direction of the next relevant price target at USD 56.03. The Fibonacci extension of 127 can be found here. An increase to the 138 Fibonacci extension at USD 60.53 is also to be considered. If the LUNA price remains bullish, a price increase up to the 161 Fibonacci extension at USD 69.98 should also be planned in the future. For the time being, the maximum price target for Terra is still to be seen in the USD 85.41 range. The Fibonacci 200 extension of the current trend movement can be found here. In the medium term, Terra could also target the 261 Fibonacci extension at USD 110.55 if the overall market is bullish.
Basic variant (Terra)
If, on the other hand, the LUNA price slides back into the blue support area and thus gives up the EMA20 and also the EMA50, the first thing to look at is the 50s Fibonacci retracement at USD 24.77. There was also a clear backlash in this zone during the week. If this support is broken, a directional decision will be made at USD 23.09. The supertrend is currently running in the daily chart. A relapse below this strong support darkens the chart for a short time. As a result, Terra should target the orange support area and the 38 Fibonacci retracement.
If there is no reversal to the north, the correction extends to at least $ 17.49. Here the EMA200 (blue) and just below the MA200 (green) are at USD 16.34. If, contrary to expectations, the bulls do not come back into the market, a fallback to the 23rd Fibonacci retracement at USD 14.15 is also conceivable in the medium term. A break in this support would activate USD 11.77 as the bearish max target. The current situation seems to favor the bullish scenario for the time being.
Indicators (Terra)
The RSI as well as the MACD indicator are currently trending south, which is a divergence from the price movement of Terra. Only when the RSI can sustainably break back above 55 will the picture for the indicators brighten again.
Worst price development among the top 10 altcoins:
Binance Coin (BNB)
Price analysis based on the value pair BNB / USD on Binance
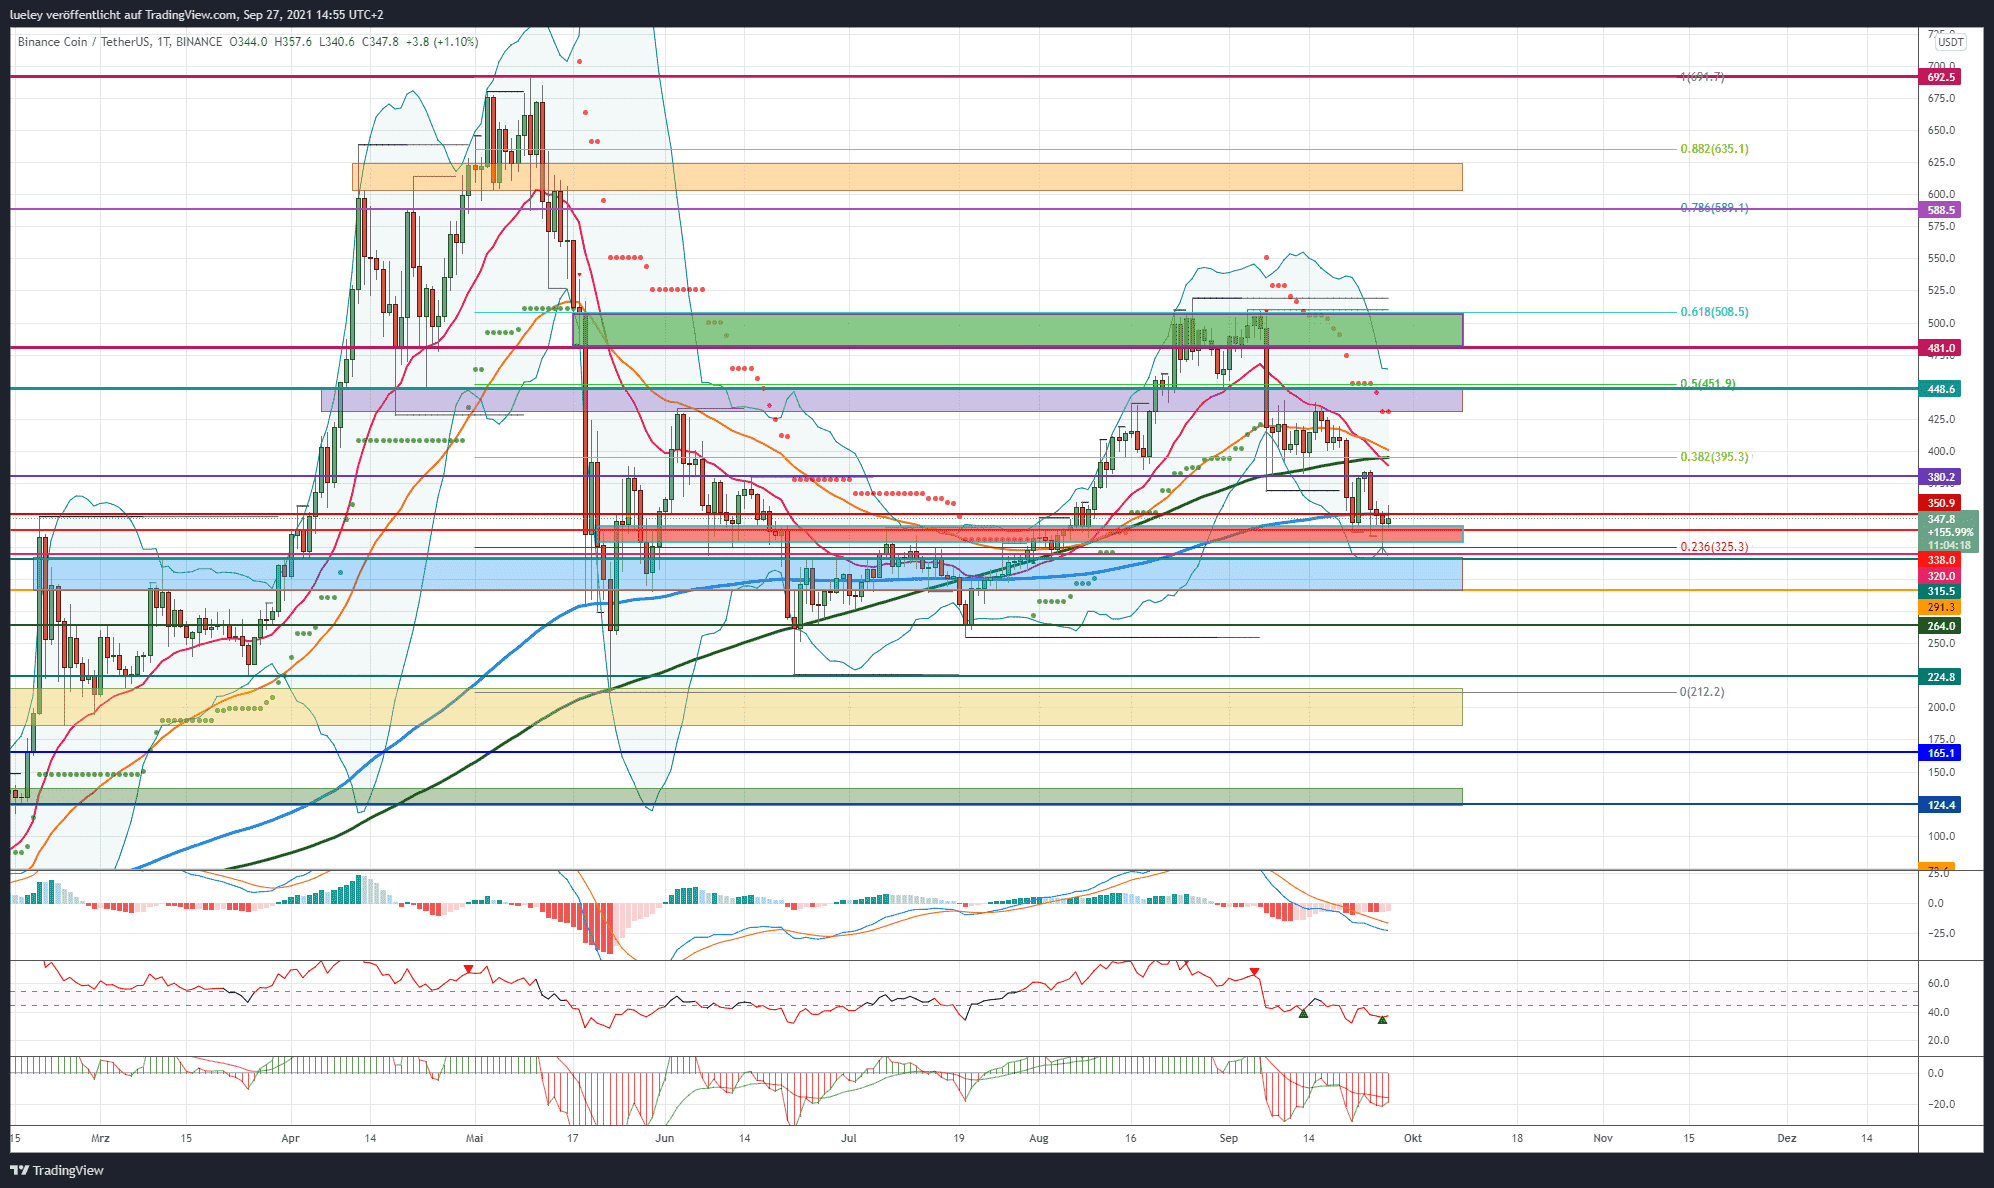
Of the Binance Coin BNB is currently coming under increasing pressure. After the suspension of derivatives trading in more and more countries and the ban on spot trading in Singapore, Binance is increasingly losing customers. As a result of this uncertain outlook, the BNB rate clearly has to give way and is trading at USD 350 this Monday morning at exactly the area of the EMA200 (blue).
Bullish variant (BNB)
As in the previous week, the BNB rate continues to lose value and is around 15 percent lower than in the previous week. This threatens the chart image for BNB to deteriorate further. The bulls must now do everything possible to stabilize price above this important sliding support. It is imperative to avert a closing price below the weekly low of USD 320. If the buyer succeeds in defending the USD 350, the focus should first be directed towards USD 380 and especially USD 395. There is a whole bundle of resistance here.
The 38 Fibonacci retracement, paired with MA200 (green), EMA50 (orange) and EMA20 (red), all run in this area of the chart. An immediate reconquest is therefore unlikely. Only when the BNB price is able to lift the daily closing price back above this strong resistance does the chart light up a little. Then the lower edge of the purple resistance area comes into view. The supertrend also runs at the USD 430 mark in the daily chart.
Should the BNB rate subsequently also overcome this resistance level, an increase to the 50s Fibonacci retracement at USD 451 is conceivable. If the bulls can break the 50s Fibonacci retracement at USD 451 per day’s closing price, the next target area between USD 480 and USD 508 will be activated. This is where the 61’s Fibonacci retracement of the overarching trend movement can be found. Only when the USD 508 is recaptured in the long term is a walk-through up to USD 589 to be planned. Here is the 78th Fibonacci retracement of the current movement. As long as Binance continues to struggle with regulatory constraints, an increase into the orange resistance zone between USD 608 and USD 624 is unlikely. The all-time high of USD 692 currently seems difficult to achieve and represents the maximum price target for the time being.
Basic variant (BNB)
The bears seize the opportunity and are increasingly pushing the BNB course southwards. If the downward momentum continues to gain momentum and slides back to the weekly low at USD 320, a directional decision will be made at short notice. A fall back below the 23 Fibonacci retracment should initially correct the BNB rate to USD 315. If the course does not turn north here, a correction widening to the lower edge of the blue support area at USD 291 is to be expected. If BNB breaks the lower edge of the blue support zone, the downward movement extends to at least USD 264. The last lows at USD 253 could also be restarted. If the low of July 20 is also dynamically undershot, the probability of a correction widening to the last low at USD 224 increases.
A relapse to the May 23 low at USD 212 is also conceivable. If the bulls do not come back on the floor here either, a setback to the support area at USD 186 cannot be ruled out. A renewed overall market weakness would open up space up to the USD 165 mark in the medium term. If Binance comes under further pressure due to increasing regulatory hurdles in the coming months, the BNB price could even approach its maximum bearish price target of 124 USD in the medium term. For the time being, investors should wait on the sidelines to see how Binance can reposition itself so as not to lose even more users.
Indicators (BNB)
Both the RSI and the MACD show a sell-signal on a daily basis. The RSI indicator is currently trading in the 30 range and appears to be oversold in the short term. However, since both indicators also show sell signals on a weekly basis, it will cost the bulls a lot of strength to be able to take over the helm again.
Top 10 stability
Bitcoin crashed significantly on the early Friday morning of September 24th, losing a good seven percentage points on a weekly basis. With the exception of Terra (LUNA) with a price increase of ten percent, all of the top 10 Altcoins are losing some of their value significantly. The Binance Coin (BNB) fell by 14 percent and was the underperformer of the week ahead of Polkadot (DOT) with a 13 percent decline in price. Dogecoin (DOGE) also had to cope with a sharp drop in price of just under 12 percent. For the first time in a long time, the ranking of the ten largest cryptocurrencies has not shown any changes in position this week.
Winner and Loser of the Week
News about the ban on transactions in cryptocurrencies in China sent the overall market down shortly before the weekend. This means that the vast majority of the top 100 Altcoins are losing value again this week after a mixed week before. Only around 10 top 100 Altcoins can book a price increase for themselves. The list of winners is headed by Decentralized Social (DESO) with a price premium of 62 percent, followed by cYdX (DYDX) with 47 percentage points. XDC Network (XDC) also ended the week with a 31 percent surcharge. The long list of losers is led by a large margin by the Huobi Token (HT) of the Huobi crypto exchange with a 47 percent drop in price.
Huobi announced over the weekend that it would no longer allow new users from mainland China. In addition, existing customers from China will also be excluded from trading in cryptocurrencies in the coming period. The in-house OKB Coin (OKB) of another Asian exchange with Chinese customers also loses a good 20 percentage points in value. In addition, Filecoin (FIL), Near (NEAR) as well as Serum (SRM) and IOTA (MIOTA) also fall more than 20 percent to the south.
Disclaimer: The price estimates presented on this page do not constitute buy or sell recommendations. They are only an assessment of the analyst.
The chart images were created using TradingView created.
USD / EUR exchange rate at the time of going to press: 0.84 euros.