
Nothing is going anymore…– The bitcoin fell, tonight, below $21,000, i.e. a total of 70% drop since the all-time high in November 2021. The macroeconomic context is still complicated and the announcement of rising inflation in the United States has not not reassure investors who have decided to sell. Because of’rising inflation, investors believe that rates will be increased more significantly than expected. The answer will be given on Wednesday at the FED meeting. In the meantime, Bitcoin has broken an important support at $30,000, and Ethereum has returned to its ATH of January 2018. Let’s analyze the state of the market and the important levels for the following events.
The Macro Hebdo point is offered to you in collaboration with the Coin Trading and its algorithmic trading solution finally accessible to individuals.
Weekly Support Breakout for Bitcoin
Buyers failed to hold the support weekly, it will take time for Bitcoin to regain bullish momentum:
Bitcoin has broke the ultimate support at about $30,000 and heads for the next strong support at $19,000. Along the way is the moving average 200 periods which supported the price during the last bearmarkets. This famous moving average, will it serve once again as support, or is this just the start of a cryptocurrency bear market? Everything is possible, especially when we look at the macroeconomic context. Investors are alleviating their capital in risk on assets, and cryptocurrencies are part of it.
Bitcoin could enter a tidy Between $19,000 and $30,000 for the next few weeks and months. The summer is normally rather calm on the institutional side, the probabilities are low to see Bitcoin return to its range between $30,000 and $60,000. The area to $30,000 will now do resistance in the future.
Safe-haven assets: gold still under resistance at $1,870, the dollar continues to rise
Gold under resistance, but more resilient than Bitcoin
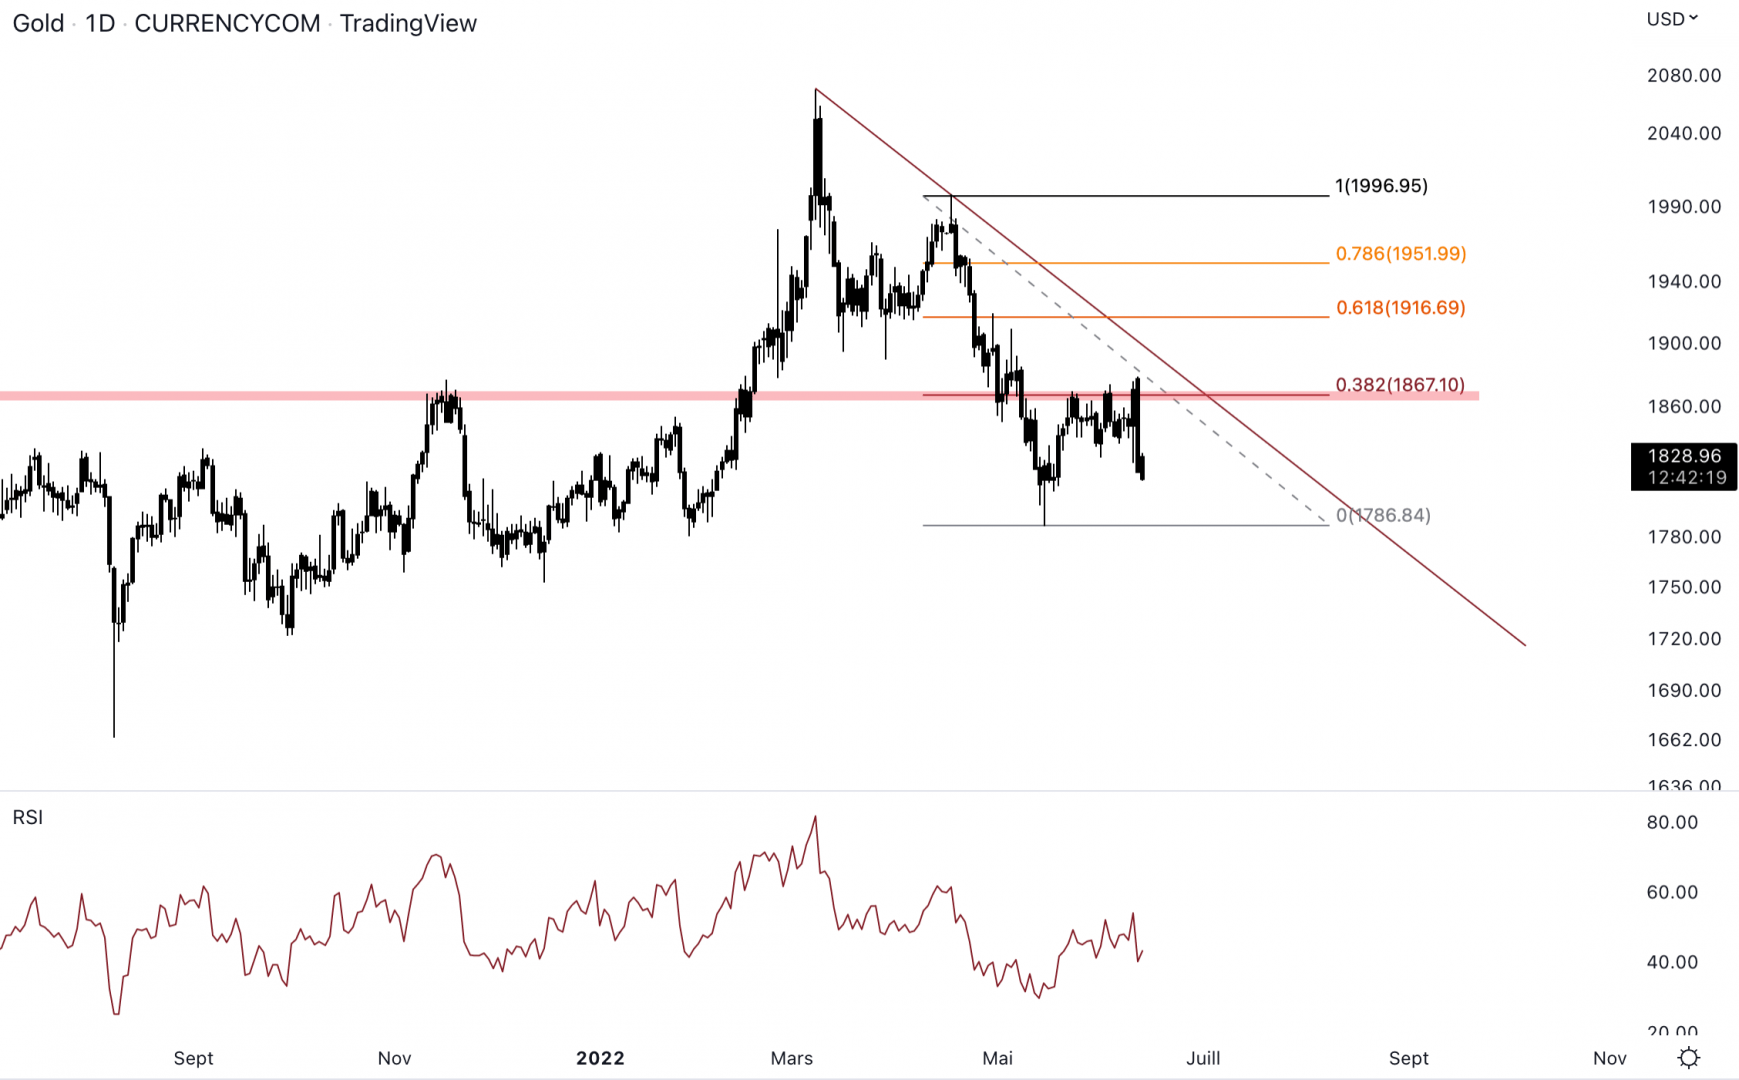
The gold is in bearish momentum daily and below the downtrendline (Brown). The safe-haven asset could try to develop a bottom close to the last low at $1,790. Currently it is stuck on the resistance in red and on the first stop (0.382 Fibonacci retracement). If these resistances give way, it is probable to find the gold between $1,915 and $1,950.
The momentum is always brittle for the moment, it will be necessary for the RSI to develop above 50 on a daily basis.
It is interesting to follow Bitcoin against gold. Indeed, even if the two assets structurally similarthey are opponents in the financial markets. Players consider Bitcoin as a very risky asset unlike gold. The study of gold against Bitcoin reveals where is the capital going :
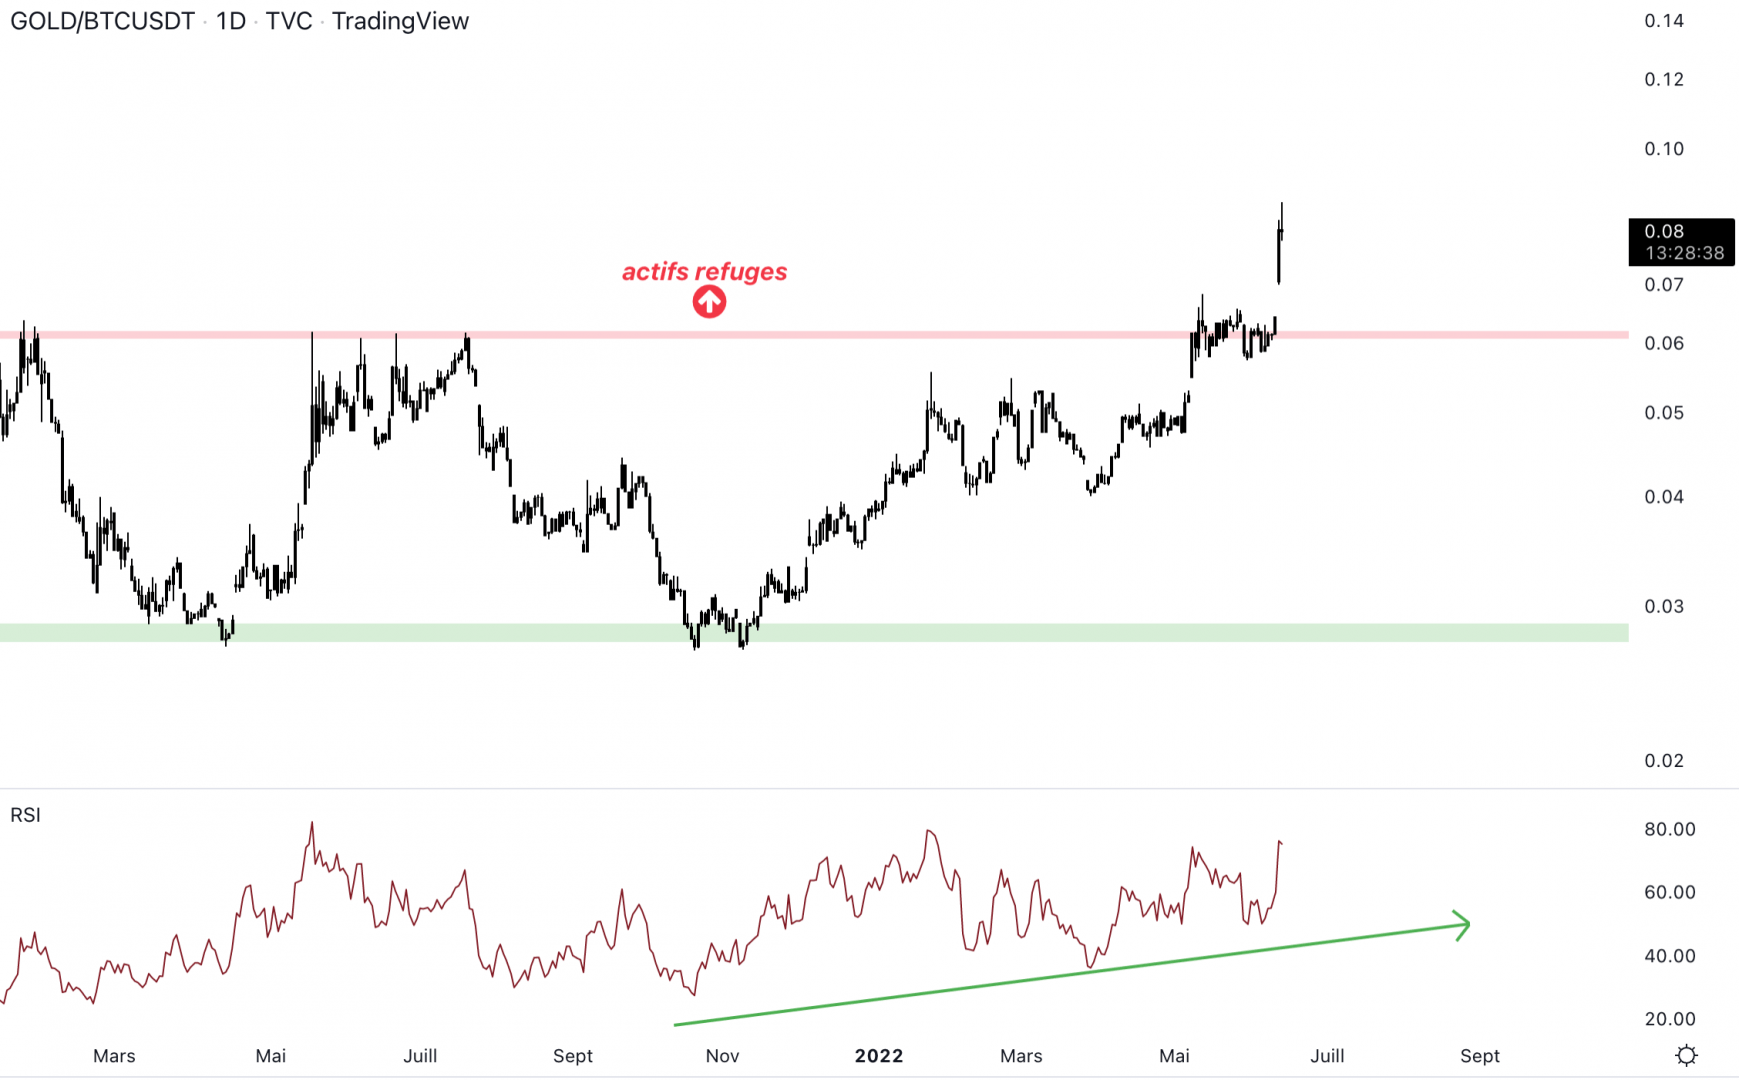
Since the rebound at the bottom of the range, capital was heading towards the safe haven assets. The range broke from the top, and it’s a bad news for the cryptocurrency market and risky assets. It seems that the trend is confirmed, we will have to be patient before seeing Bitcoin perform again.
The dollar still stronger than bitcoin
The dollar is a real problem right now for risky assets. While there was the possibility of changing the bullish momentum installed since August 2021, the dollar resumed its bullish momentum :
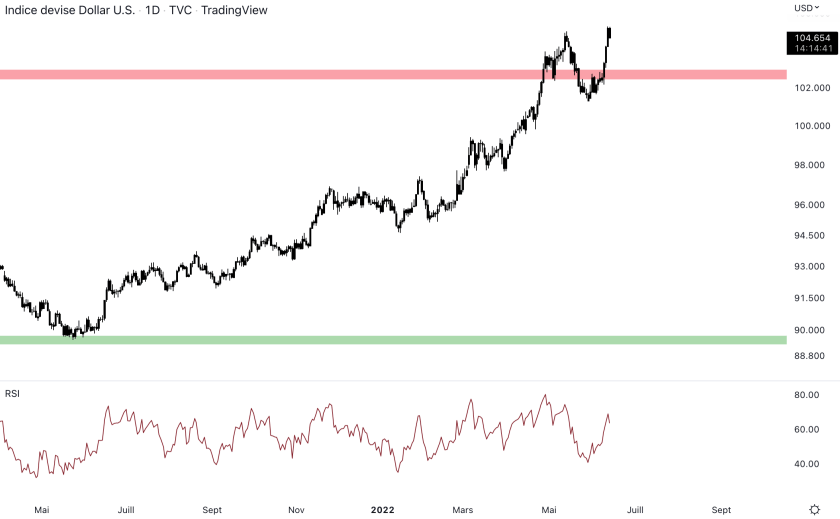
The dollar continues to rise with this continuation “W” after falling below the resistance (red). The momentum remains bullish until proven otherwise.
The momentum has revived at the level of 40 of RSI which corresponds to a support for ROI of the dollar index.
The stock market falls and follows Bitcoin, continuation of the downward momentum
Last week, we were talking about the possibility of structuring a range zone on the US markets. It would seem that the rise in inflation annihilated this hypothesis. The market is heading for a bearish continuation. The market is expecting a rate hike, sellers are regaining control.
The S&P 500 makes a new low
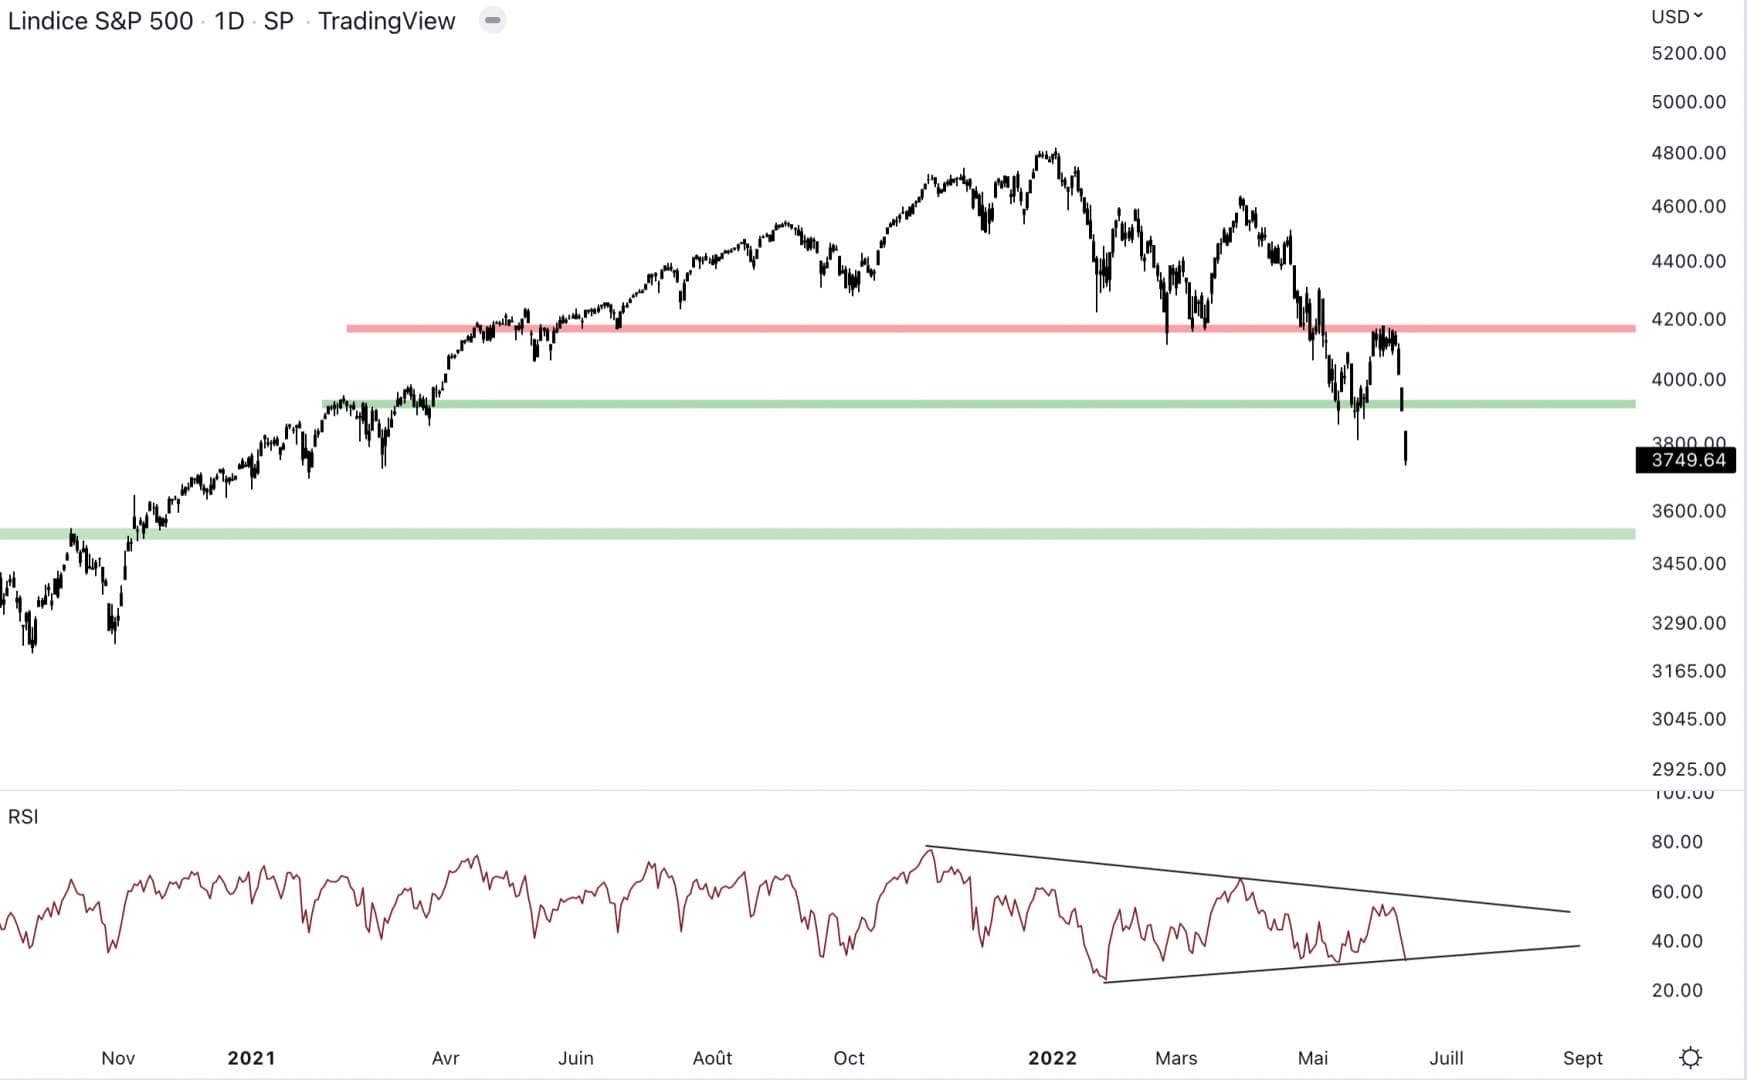
Last week, we thus hypothesized a range to come between $3,900 and $4,170 for the weeks to come. Yesterday the S&P 500 made a new low and seems to be heading for the next one bracket at $3,500. The momentum is therefore in contraction and this usually leads to volatility.
We will have to wait for the S&P 500 change of dynamic to think that the decline is over. For the moment, the bearish momentum continues.
New low coming for Coinbase?
Coinbase rebounded well close to $40 and the course goes there again:
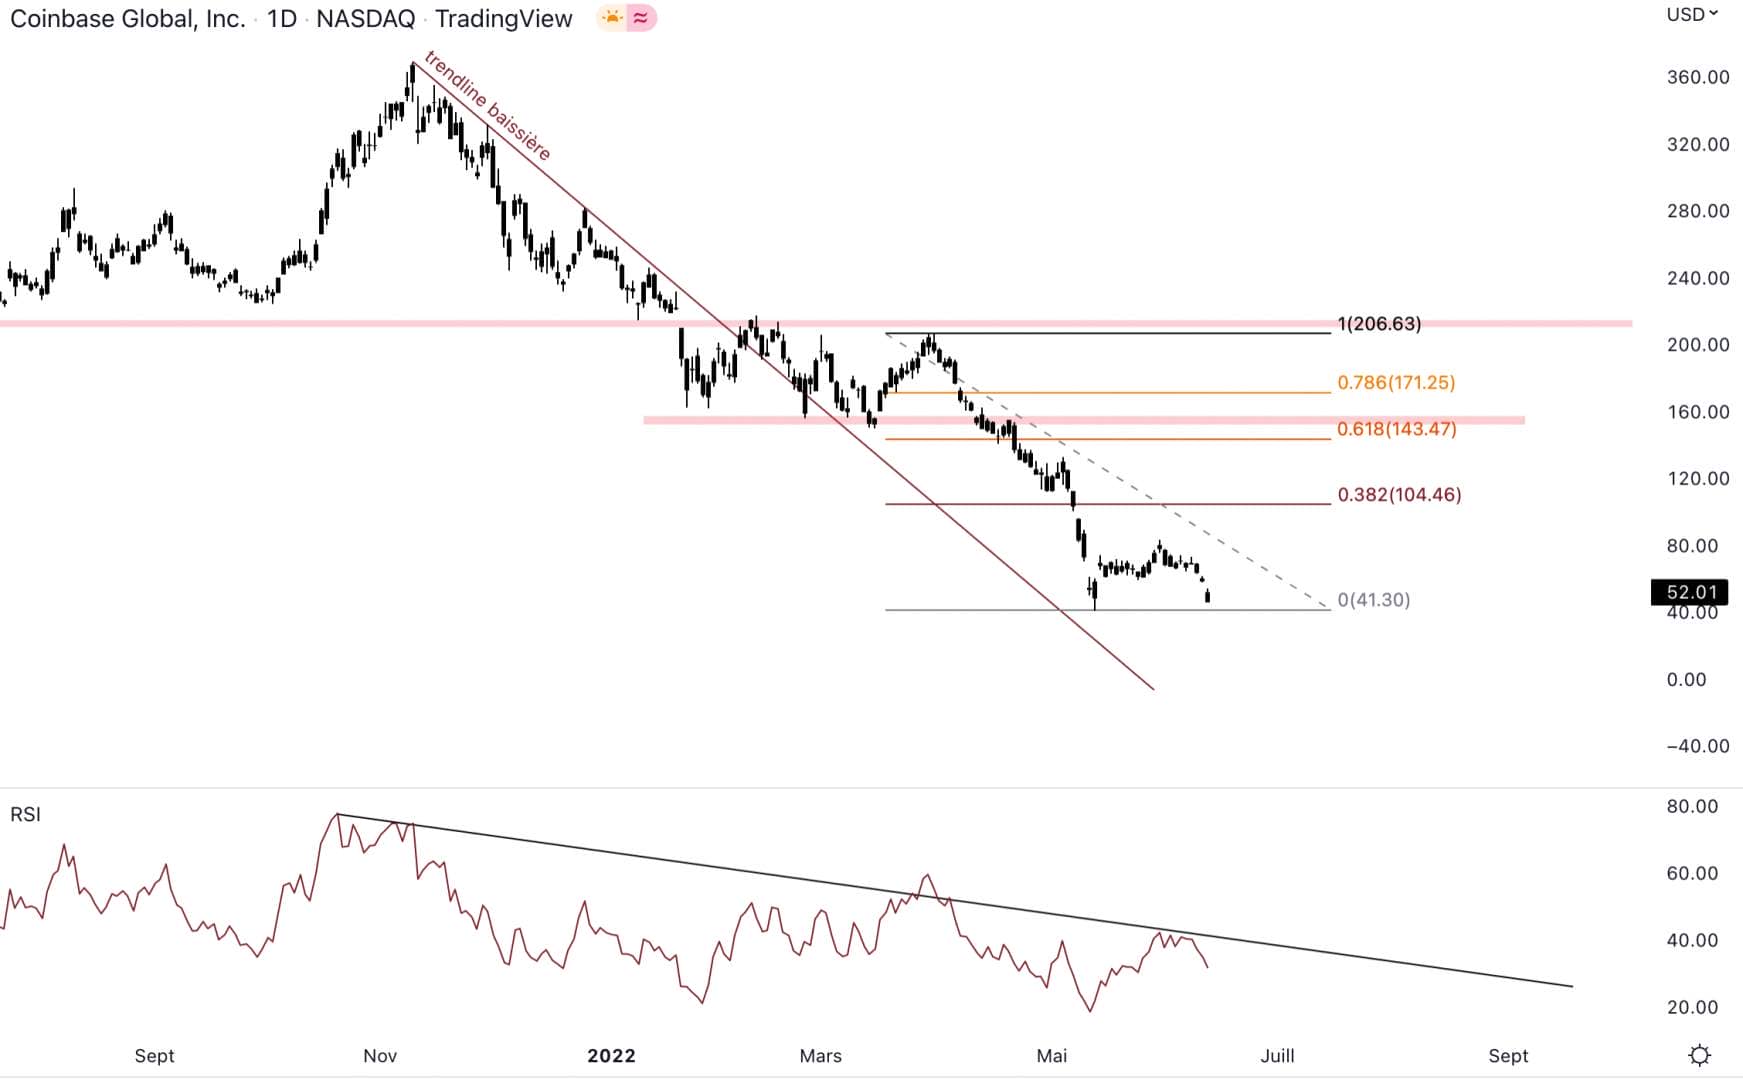
Coinbase is a publicly traded cryptocurrency exchange. Since this marked a top in November 2021, cryptocurrencies follow. We will have to be attentive to a trend reversal on a weekly basis. For now, the action remains bearish in all units of time.
It seems unlikely that the stock will rebound back to the level of $41. If the US market falls, Coinbase will also fall.
The momentum is always bearishbecause below the downtrendline. this trendline is powerful and shows that sellers have the hand. It will therefore be necessary to be attentive to the break of this trendline which could be synonymous with a lateralization on the price or even a change of trend. For now, the action remains bearish and that is not not a good sign for cryptocurrencies.
Back to $11,000 for the NASDAQ
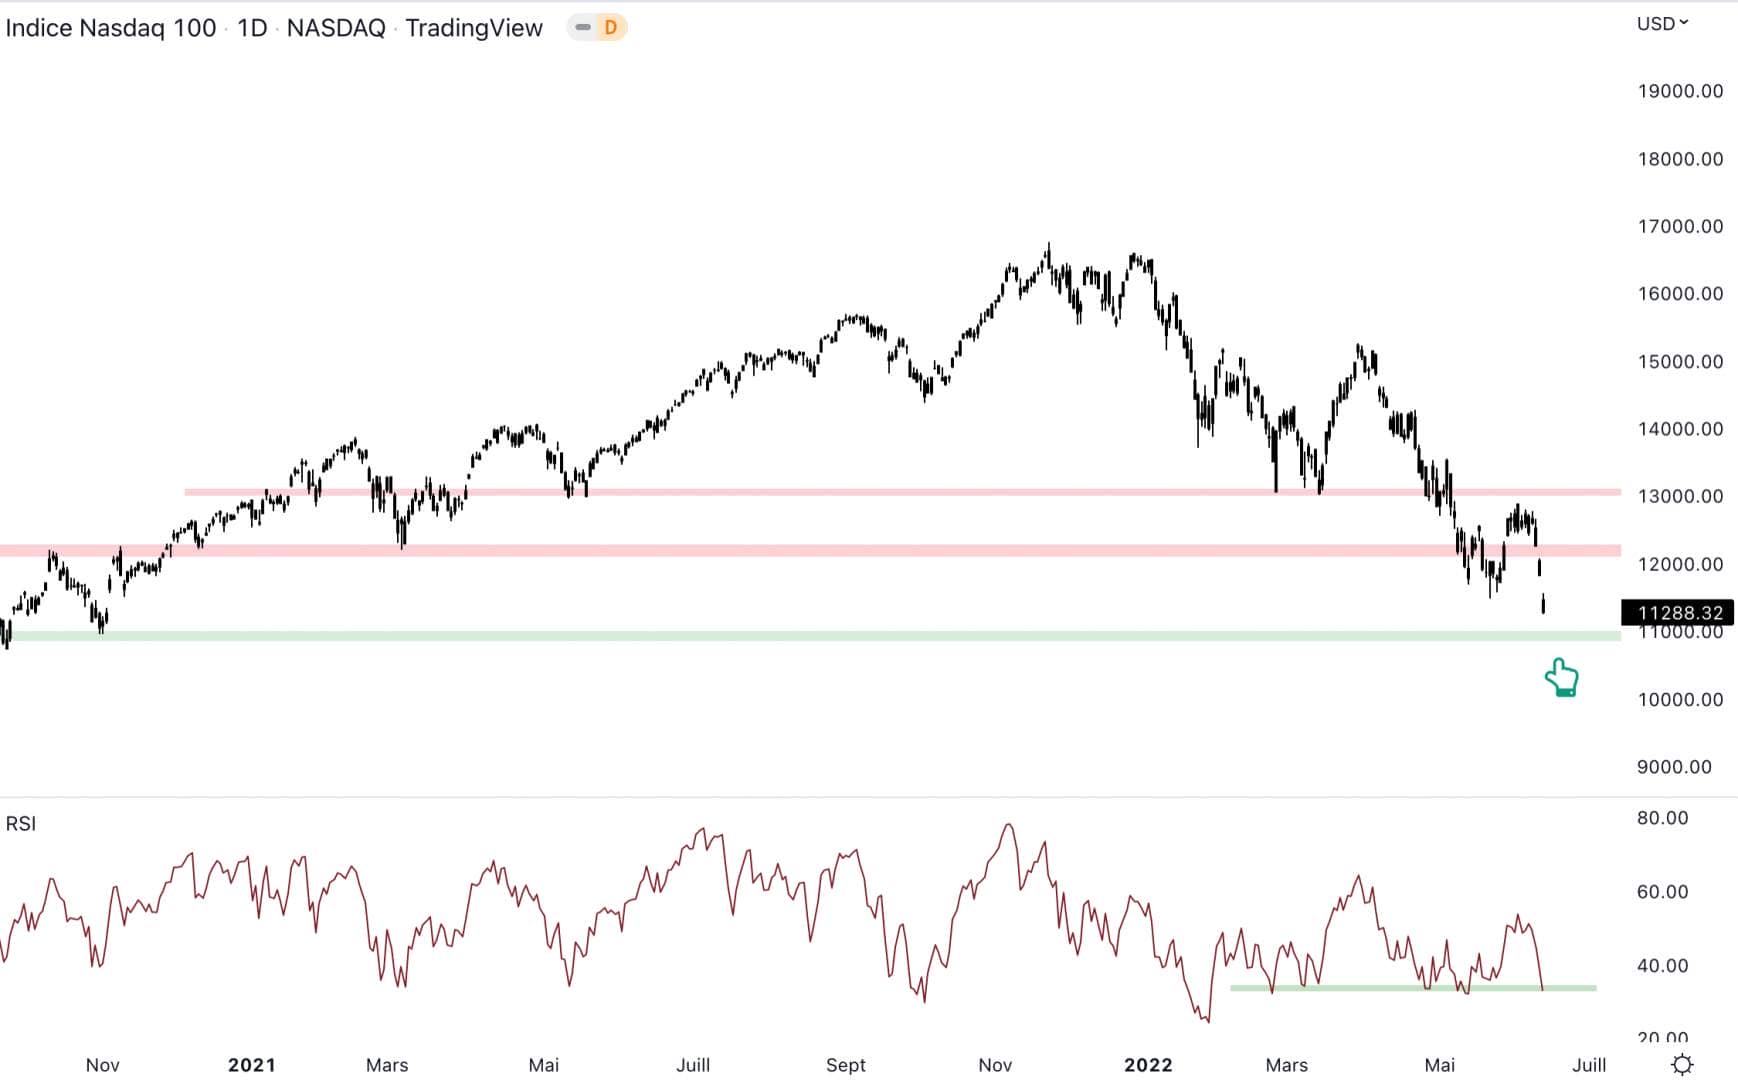
The Nasdaq is trending bearish and the index hit a new low yesterday. There are gaps that could be filled above the price and near the resistance at $12,200. The next support it is located at $11,000 and it looks like the NASDAQ is headed there. Wednesday’s meeting should move the price, and, perhaps, intensify the decline.
The momentum is close to a support area. The RSI should not settle below this zone, because, for the moment, the momentum remains solid.
the Bitcoin has lost a significant level and nothing indicates that the fall is over. It will take time for Bitcoin to regain bullish momentum. We must also take into account the macroeconomics with growing inflation and the war in Ukraine which does not stop. The US market already seems to have taken a bearish direction as an important meeting arrives on Wednesday to decide on a higher rise than initially expected. The markets are often ahead of the decisions, we will see if this is the case on Wednesday. Capital continues to flow into the dollar and, as long as it does, we will have to be vigilant with risky assets like Bitcoin.
Is it possible to be gwinner every time? Whether the price of Bitcoin is in great shape or going through turbulence, Coin Trading offers you to increase your chances of success. Indeed, Trading Du Coin allows individuals to access a trading tool algorithmic and 100% automated. A real trend mechanism, this tool has been designed to adapt to market reversals and position itself on the most dynamic crypto-assets of the moment..