The charging curve of an electric car is often described as the key to whether the vehicle is a charging champion or not. What is behind this important concept of electric mobility?
Electric car manufacturers frequently highlight the fast charging power of their vehicles, sometimes forgetting to point out that maximum power is not always what is most important. On most plugged-in cars, the power peak is very brief and does not reflect the reality of a fast charging session.
Thus, most often, the overall shape of the charging curve is anything but flat, presenting a less rewarding view of certain cars which promise to break charging records. If you feel a little lost in the face of all these notions, don’t worry: let’s clarify this concept right away, and the recharge curve will no longer have any secrets for you.
What is a recharge curve?
The recharge curve corresponds to the evolution of the power that the battery can receive over time.
Is maximum charging power such important information?
Communication from electric vehicle manufacturers often focuses on two aspects when talking about fast charging: maximum power and the time needed to reach a certain battery level. We can, for example, read on the Hyundai website that the Ioniq 6 goes from 10 to 80% in 18 minutes, or on the Tesla website that the cars accept 250 kW of maximum charging power.
However, two cars with equal maximum charging power are not always equally efficient when it comes to filling their batteries as quickly as possible. The average power is what is authentic in this exercise, and not the maximum power. People who are getting started with electric mobility sometimes struggle to grasp this idea, but the more full an electric car battery is, the less quickly it will accept charging.
We could make a simplistic analogy with filling a gasoline tank on a thermal car: when the tank is empty, we can send gasoline at the maximum flow rate of the pump. As it is filled, if you do not want to overflow, but still fill to the maximum, you must start dosing the pump handle.
On an electric car that charges with direct current, it’s the same observation, but more pronounced. For most electric vehicles, maximum power can be reached when the battery is less than 30% charged, after which the power will gradually decline. We often find comments from new owners who are surprised to never see, or almost never, the power promised by the dealer or in the brochure for their vehicle. Let’s see why.
A battery that needs to be pampered
The mission of an electric car’s battery management system is to protect the battery pack, in addition to getting the best possible performance from it. For this, it is imperative to put in place numerous safety features so as not to permanently damage the battery.
For example, electric car batteries do not like to be too cold, it will be impossible for you to reach the maximum theoretical powers if the battery pack is not at its ideal temperature. After a night in the cold of winter, some electric cars go so far as to refuse to charge when plugged in: instead, all energy is used to power the battery’s heating circuit, and when it reaches a sufficient temperature, charging can start.

Many electric cars therefore offer pre-conditioning of the battery before fast charging (either automatically when the destination is a fast charger, or on request), in order to ensure good charging performance. However, this is not always sufficient, since the battery must also not be overfilled, as we mentioned above.
This is why, to obtain the best performance in fast charging, it is advisable to stay in a range between 10 and 80%. Beyond 80%, for almost all connected vehicles, the charging power drops so much that it is not worthwhile to continue charging. It is better if possible to cut the road, even if it means stopping for a few minutes a little further along the journey, rather than staying 30 minutes or more to reach 100%.
Now that you know that you need a battery at ideal temperature and at a fairly low charge level, it’s time to tackle the piece de resistance: the recharge curve.
Does the ideal charging curve exist?
When all the conditions are met for the battery to be in the best condition, the charging power limit can still be defined by the car. By this we mean that if you charge at a terminal that promises 350 kW, that does not mean that your car will accept it.
In this case, there is virtually no car to date that can take advantage of the most powerful charging stations installed in the region, and that is rather a good thing. In effect, this means that these terminals will still be good to use in a few years, when cars can take full advantage of them.
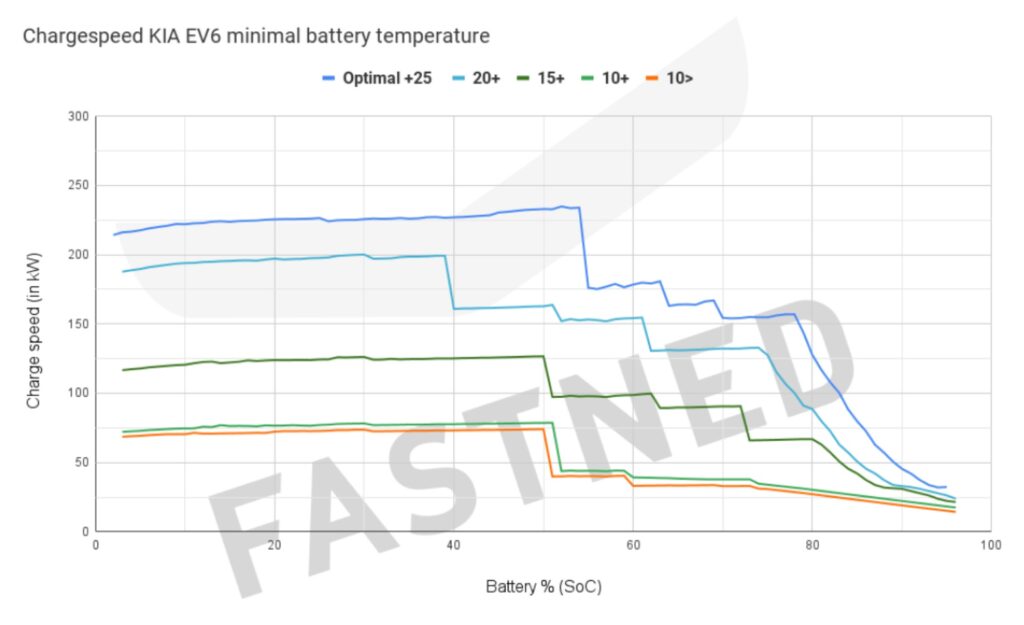
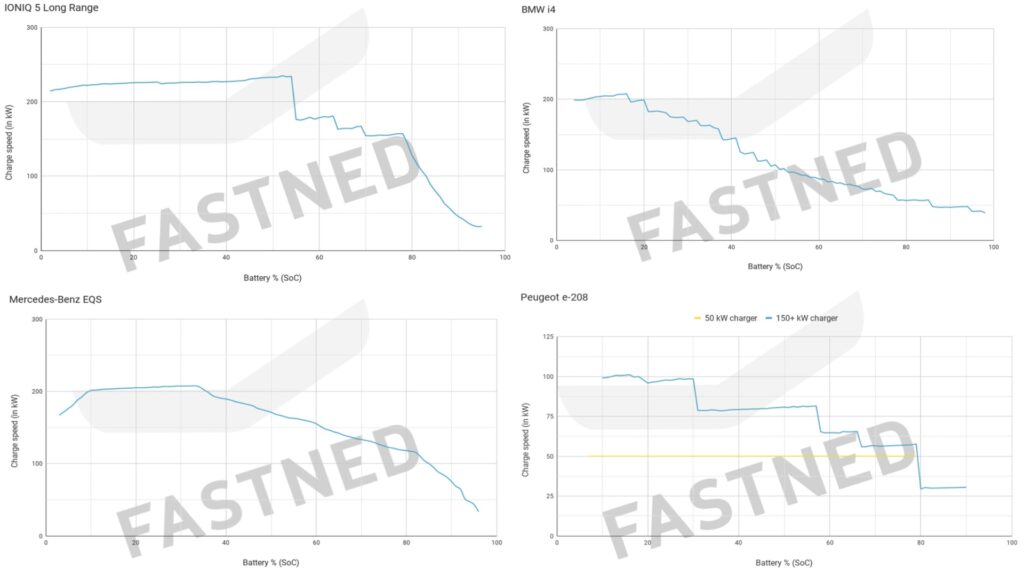
While awaiting these possible future advances in the development of innovative battery technologies, today’s terminals can generally exceed the power accepted by the car. The car will therefore communicate with the charging station so that the power sent corresponds to what the battery can absorb. As you can see from the examples below, the appearance is often similar between all the cars.


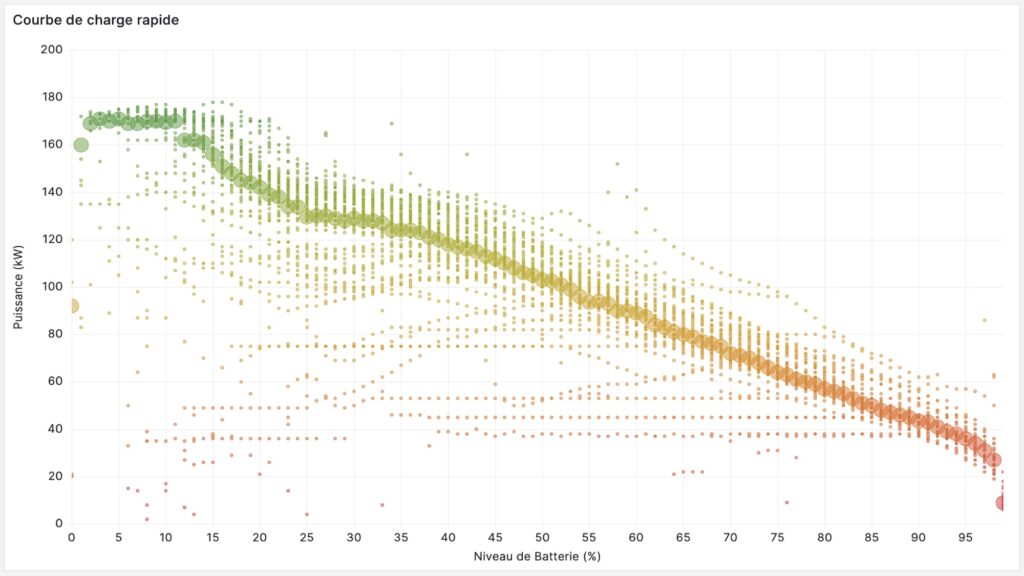
There is a power peak when the battery is lightly charged, and gradually, the power drops as the battery fills up. The Fastned support site is full of examples made available. Reports provided to Numerama by Teslamate cover more than a hundred DC charges. They are grouped into a graph below.


The average is symbolized by the circles with a larger diameter. We thus see that after a plateau at 175 kW, the power gradually decreases from 15% battery, up to 100%. All points visible on the graph represent charging power reached at a certain battery level, showing that not all charging sessions are the same.
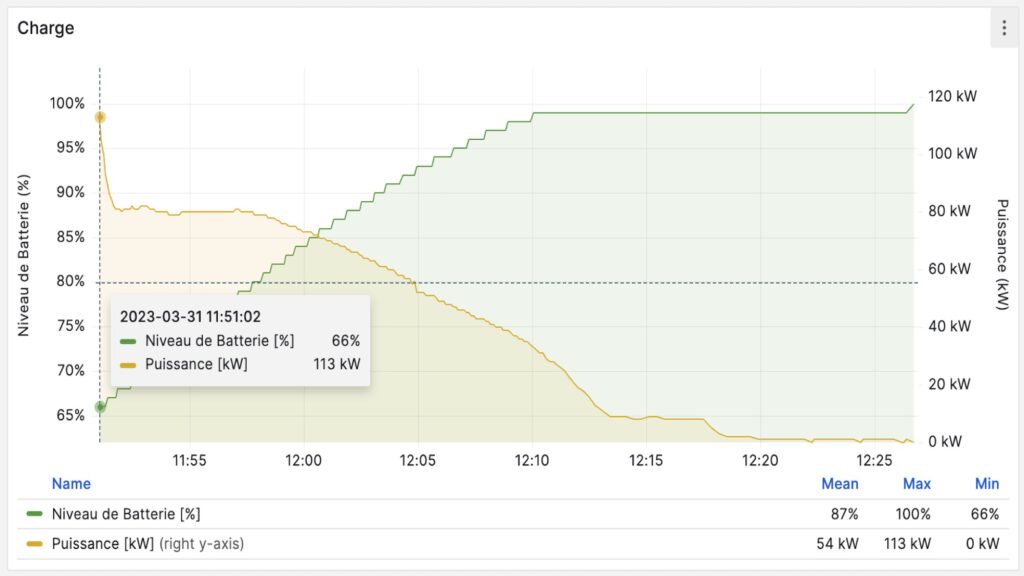
For the example below, note that sometimes, charges starting at a high battery level (more than 50%) allow you to achieve a higher power than what you would have had if the session had started with a lower level. This is a particularity of LFP (lithium – iron – phosphate) batteries which allow you to benefit from a high-power charging peak, even when still having a lot of battery remaining. However, we must come back to reality: this peak is very short-lived.


Manufacturers can sometimes improve charging performance during remote updates, but the laws of physics remain as they are. You shouldn’t expect to be able to charge a car 2 or 3 times faster as developments progress, unfortunately.
Towards a better way to measure the load?
As you could see from the examples of charging curves presented above, the maximum power reached is not necessarily very useful information when we are talking about charging an electric car. It is important to consider not only the average power of a charging session, but also the consumption of the vehicle in question.
As has already been pointed out, some cars have larger batteries, but fail to excel on long journeys. This is because their charging power, however high it may be, does not allow us to recover useful kilometers more quickly than a car which consumes less.
Current measurement standards (EPA or WLTP in particular) with the maximum powers displayed by manufacturers do not allow us to correctly understand the reality of fast charging. Manufacturers always prefer to display a measurement that highlights them. This is why we should expect to continue to see announcements of cars that charge at “a power of up to 350 kW” in the future, even if the 10 – 90% struggles to reach 130 kW on average.
Subscribe for free to Artificielles, our newsletter on AI, designed by AIs, verified by Numerama!
