
Bitcoin’s price has been trending higher since January 24 and showing signs of completing its long-term correction, which started in April 2021.
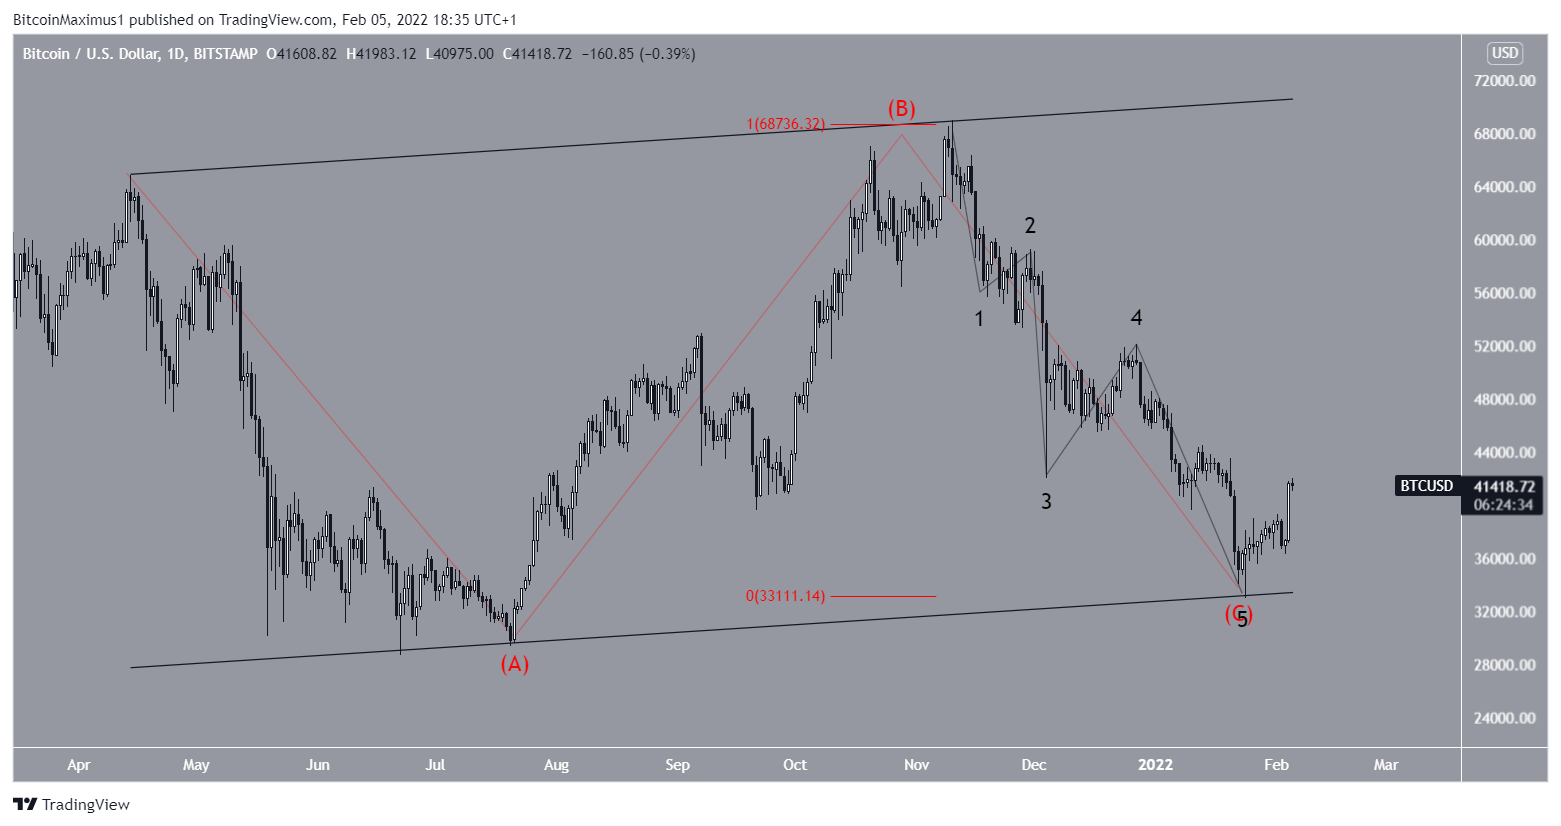
The price of Bitcoin most likely started a five-wave bullish pattern (in white) in December 2018. In this case, April 14, 2021, when BTC reached its high of $64,895 marked the top of the wave three. So, since then, the price has probably corrected within a wave four, as highlighted by BeInCrypto in our previous wave count.
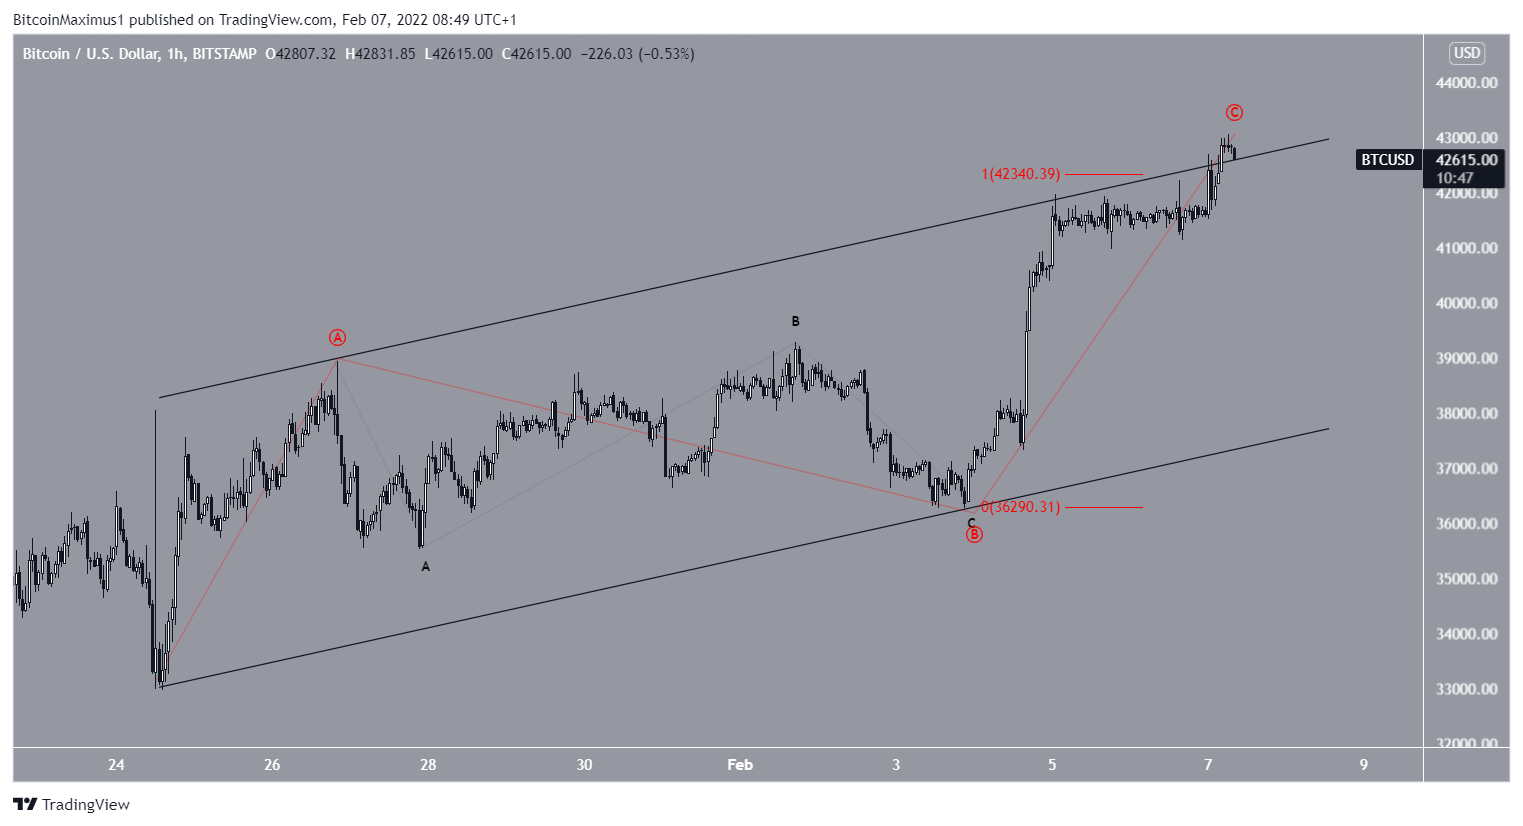
The most plausible wave count suggests that wave four ended with the local low on January 24, 2022, located at $32,950. The subwave count is shown in red. Within the latter, waves A and C have a ratio of 1:1, which is quite common in similar corrective structures.
As a result, it is possible that Bitcoin has now started the 5th and final wave of its bullish impulse.
The first potential target for the top of this upward move lies between $71,600 and $73,600. This range is obtained using the length of waves 1-3 (in white) as well as the outer retracement of wave four (in black). Beyond this point, the next target would be at $84,450 (outer Fibonacci level 1.61) and $95,325 (the full length of waves 1-3).
A full fix for BTC
As for the shorter term move, the most plausible scenario points to wave four being a full flat correction. The sub wave count is shown in black as a finalized bearish impulse.
In this scenario, the price of Bitcoin has now started a new bullish impulse within the aforementioned wave five, which could push it to a new all-time high, or even higher.
A triangle correction
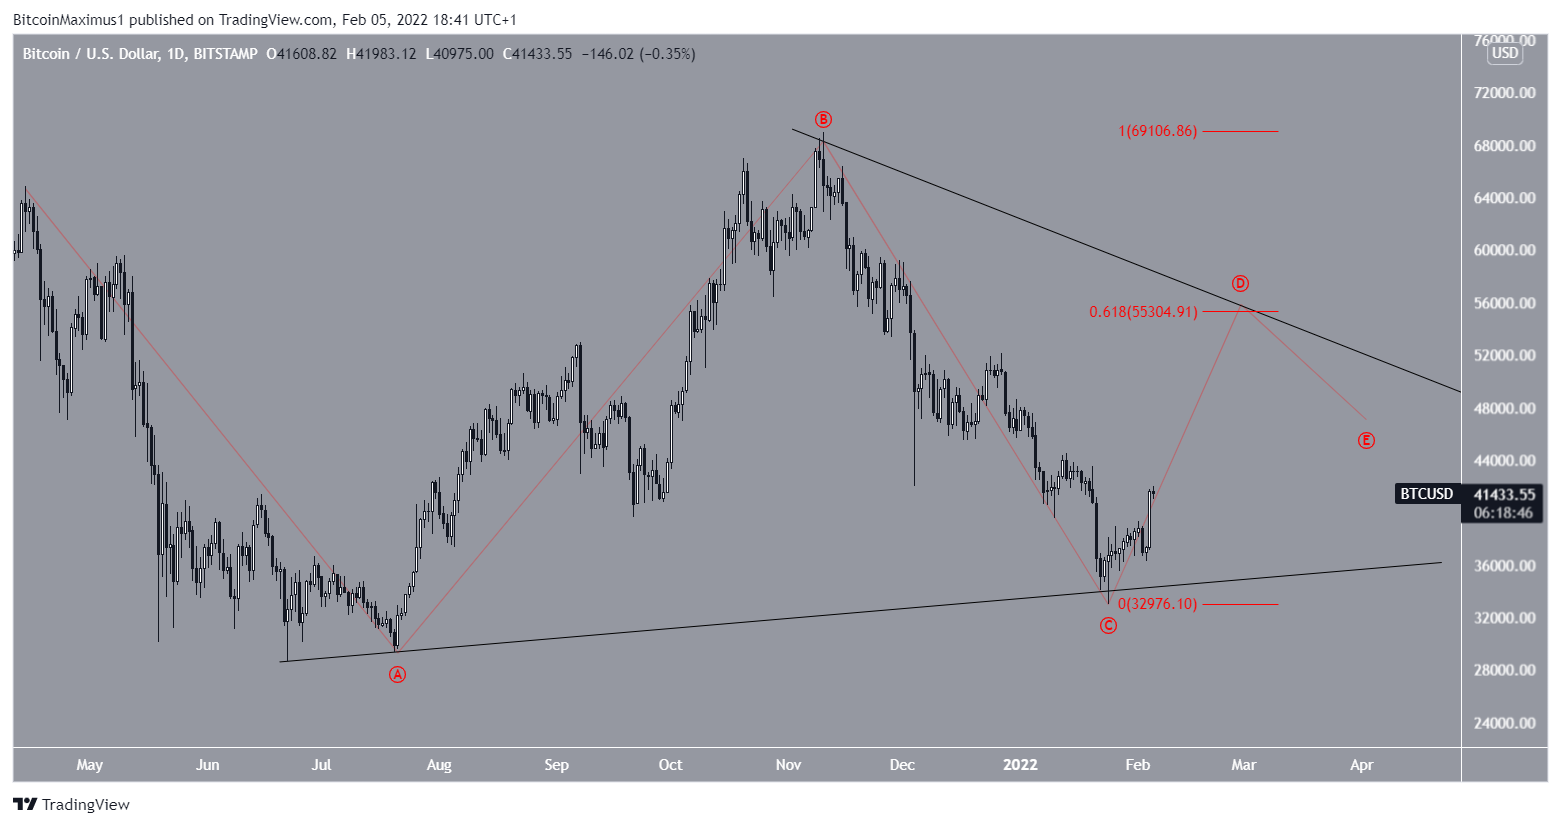
The second most plausible option suggests that BTC is still in its wave four, which would take the shape of a symmetrical triangle.
In this case, BTC could rise towards the 0.618 Fibonacci retracement resistance located at $55,250, before falling once more and completing an E subwave (in red).
The movement since January 24 would be the same in both scenarios. Currently, it cannot be determined which of these two counts is the correct one.
A final diagonal
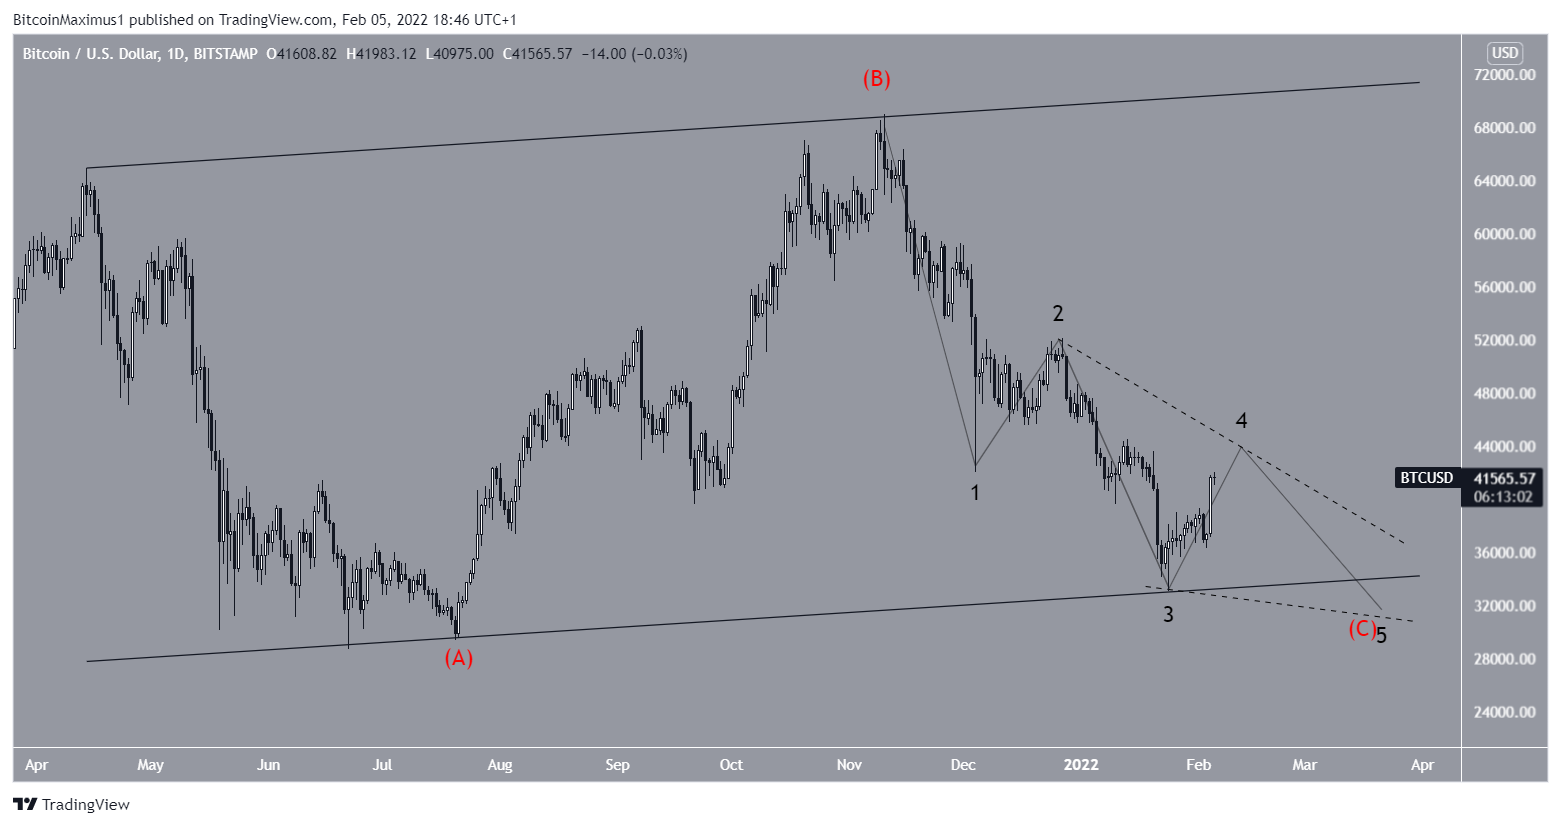
The third scenario, which is the least plausible, suggests Bitcoin’s price is completing wave C of a final diagonal pattern, which could take the form of a falling wedge.
If this scenario is correct, BTC could rise towards $44,600 before falling once more and completing its diagonal somewhere around $31,000.
This would also cause Bitcoin to fall below the ascending parallel channel it is currently trading within.
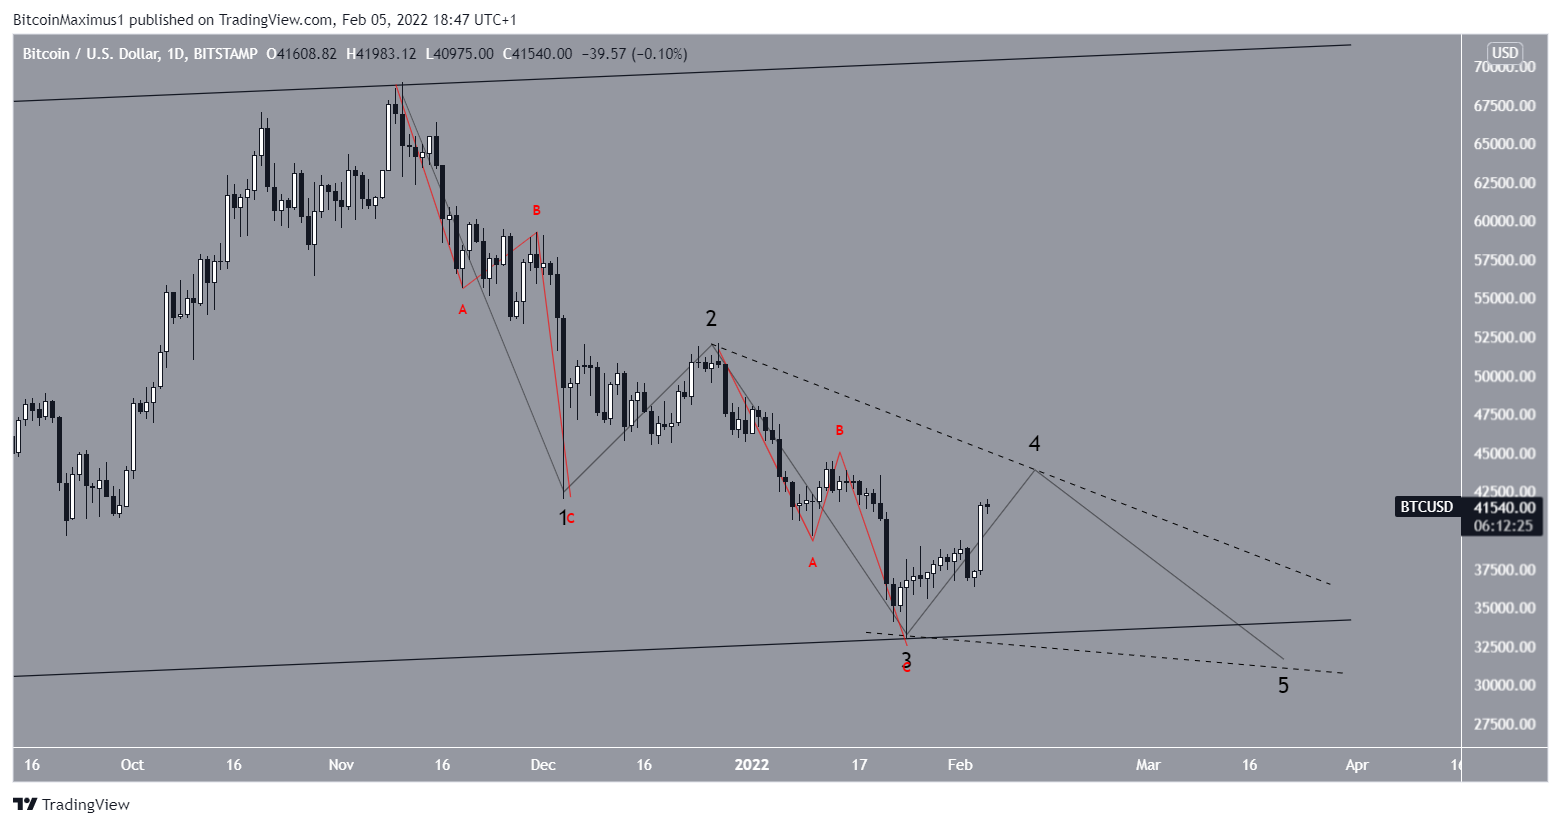
Moreover, in the case of a final diagonal, each wave must constitute an ABC structure. Due to the very moderate length of subwave B (in red), neither wave one nor wave three appear to exhibit an ABC structure.
Bitcoin’s short-term action should help determine whether or not this is the correct wave count.
Short term movement of Bitcoin
Since January 24, BTC has been trading within an ascending parallel channel. Currently, it is slightly above the resistance line of this channel.
If the whole move turns out to be a correction, waves A and C already have a ratio of more than 1:1.
Thus, if the final diagonal scenario turns out to be valid, BTC will have to suffer a rejection and start a downward movement from its current level.
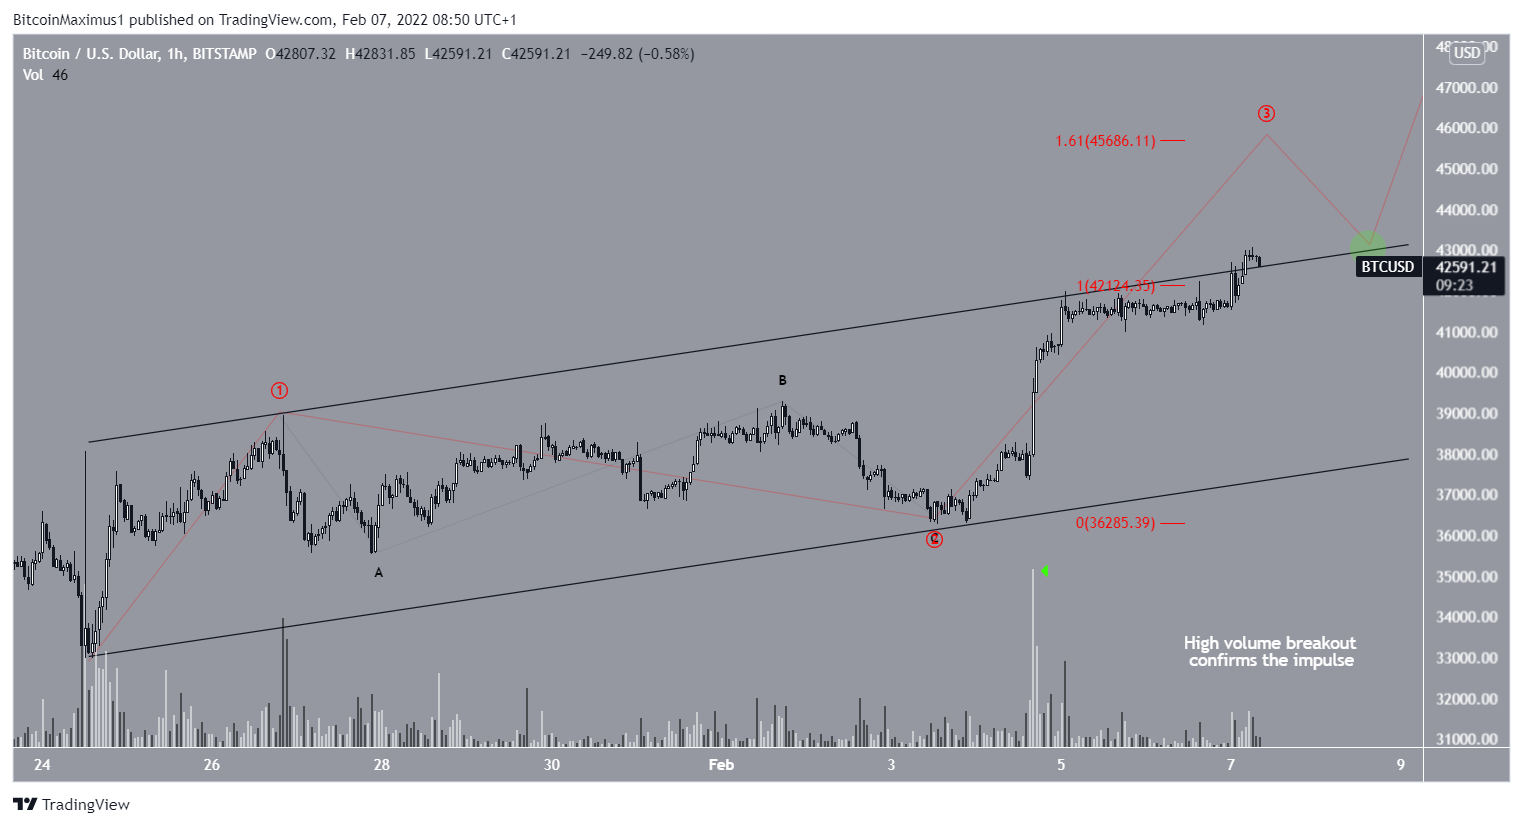
On the contrary, the most plausible scenario suggests that the upward move is part of a bullish impulse. This assumption is supported by rising volumes.
If Bitcoin were to break above its channel with significant volume, before validating it as support (green circle), it would almost certainly confirm that a new uptrend has started.
This would support the possibility that the correction is complete. That said, that still wouldn’t negate the triangle pattern scenario, knowing that the whole move could still be part of a wave A that would eventually take BTC all the way to $55,300 in order to complete this. structure.
Disclaimer
All information on our website is published in good faith and for general information purposes only. Any action taken by the reader based on information found on our website is entirely at their own risk.