- Indicator n°1: AAII Investor Sentiment Survey
The AAII (American Association of Individual Investors) is an independent, not-for-profit association established in 1978 to help individuals become effective managers of their savings and their own assets.
The weekly AAII Sentiment Survey offers insight into the sentiment of individual investors by asking them what they think the market will be heading in the next six months since 1987.
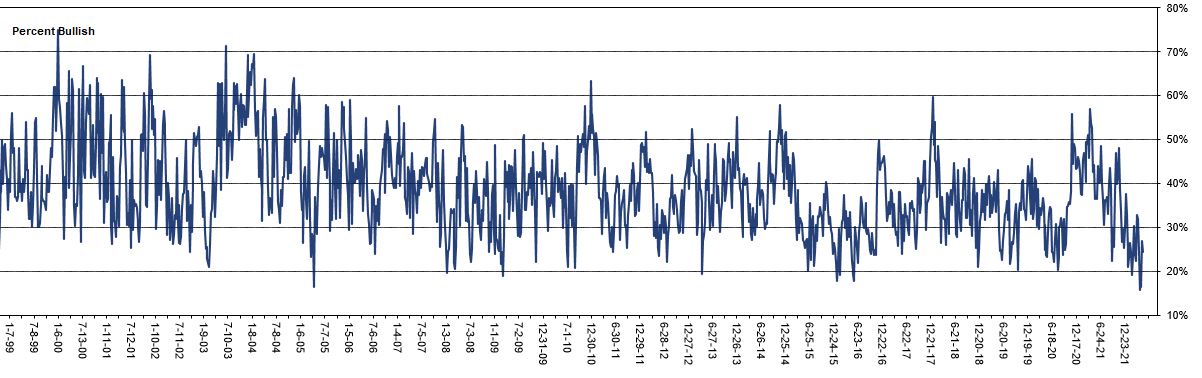
Results from the latest AAII sentiment survey show neutral sentiment rebounding from hitting an 18-month low last week. Furthermore, optimism continues to be abnormally low and pessimism continues to be abnormally high.
We are on lows as you can see on the evolution of the AAII Investor Sentiment Survey since 1999.
- Indicator n°2: The fear index in the newspapers
The number of articles suggesting a recession is only rising as the broad US S&P 500 index falls. Moreover, the recession scenario seems to be commonly accepted by fund managers. Although the number of articles evoking a recession is increasing, it mainly concerns media specializing in finance and not yet the mainstream media.
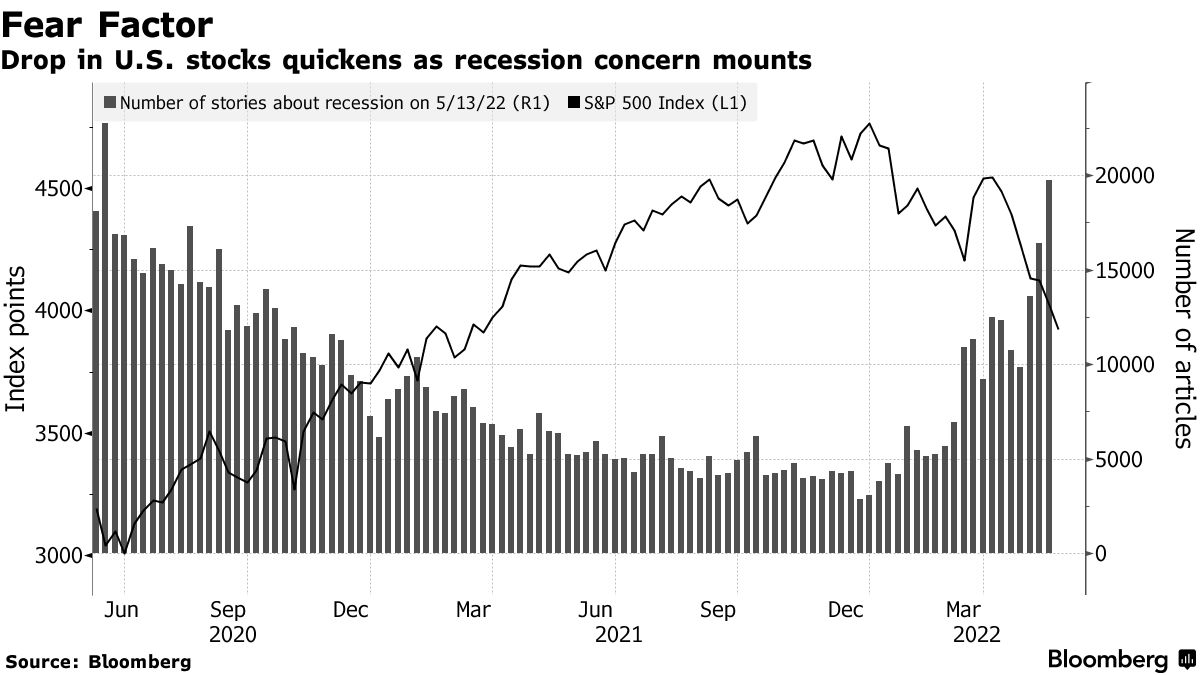
Source: Bloomberg
- Indicator #3: Fear and Greed Index
The CNN Business Fear and Greed Index is in the extreme fear zone at 9/100 on 05/19/2022). The theory is based on the logic that excessive fear tends to depress stock prices, and too much greed tends to have the opposite effect. This indicator can also be used in a contrarian way to buy fear and sell greed. The hardest part of all this is finding the right timing.
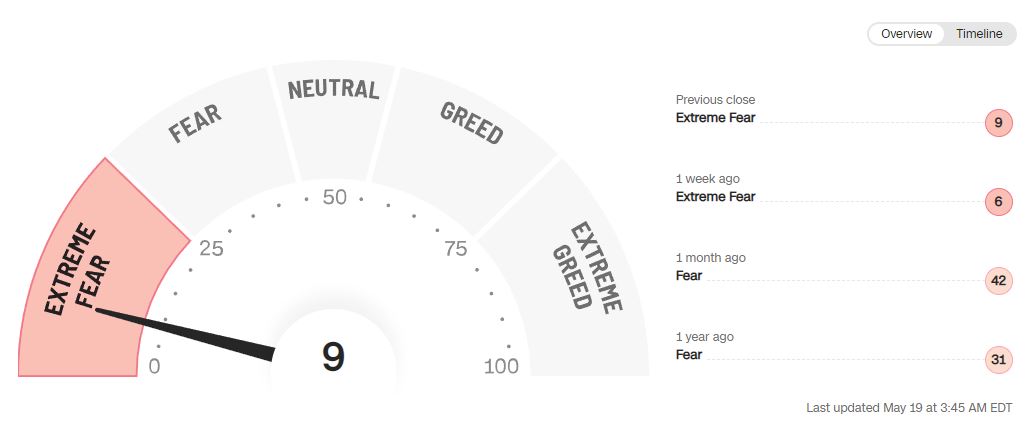
This indicator is based on 7 criteria to determine market sentiment (here the S&P 500) at time t: market momentum, relative strength of market prices, volume, put/call options ratio, volatility, demand for safe-haven assets and demand for speculative bonds (junk bonds).
- the momentum The market price is measured based on the price positioning of the S&P 500 index relative to its 125-day arithmetic moving average.
- The relative strength Market price is measured by looking at the number of NYSE-listed stocks making new highs versus the number of stocks making new 52-week lows.
- the volume is measured using the McClellan Volume Summation Index which calculates the quantity and volume of stocks going up relative to the number of stocks going down.
- the put/call option ratio : Options are contracts that give investors the right to buy or sell stocks, indices or other financial securities at an agreed price and date. When the ratio of put options to call options increases, it is usually a sign that investors are getting more nervous. A ratio greater than 1 is considered bearish.
- The best-known measure of market sentiment is the index of volatility CBOE (or VIX). The VIX measures the expected price movements or volatility of S&P 500 Index options over the next 30 days. The VIX index often drops on days when the market generally rallies and soars when stocks dip. But the key is to look at the VIX over time. It tends to be lower in bull markets and higher when the bears are leading.
- The demand for safe haven assets : In theory, stocks are riskier than bonds. But the reward of investing in stocks over the long term is greater. Bonds can outperform equities for short periods, especially during market declines. Bond demand shows the difference between treasury bond and stock yields over the past 20 business days.
- The demand for speculative bonds is measured by looking at the spread between the yields of junk bonds relative to safer government bonds. A larger gap indicates greater caution.
Conclusion
Although fear is very present and we could see a strong rebound (contrary strategy compared to these fear indicators), the consensus is settling towards a target price around 3500 points on the S&P 500. Caution is therefore called for on the indices (macro approach) although real opportunities are starting to appear almost everywhere on the markets (micro point of view).